  Sepal.Length    Sepal.Width     Petal.Length    Petal.Width
 Min.   :4.300   Min.   :2.000   Min.   :1.000   Min.   :0.100
 1st Qu.:5.100   1st Qu.:2.800   1st Qu.:1.600   1st Qu.:0.300
 Median :5.800   Median :3.000   Median :4.350   Median :1.300
 Mean   :5.843   Mean   :3.057   Mean   :3.758   Mean   :1.199
 3rd Qu.:6.400   3rd Qu.:3.300   3rd Qu.:5.100   3rd Qu.:1.800
 Max.   :7.900   Max.   :4.400   Max.   :6.900   Max.   :2.500
       Species
 setosa    :50
 versicolor:50
 virginica :50
Code
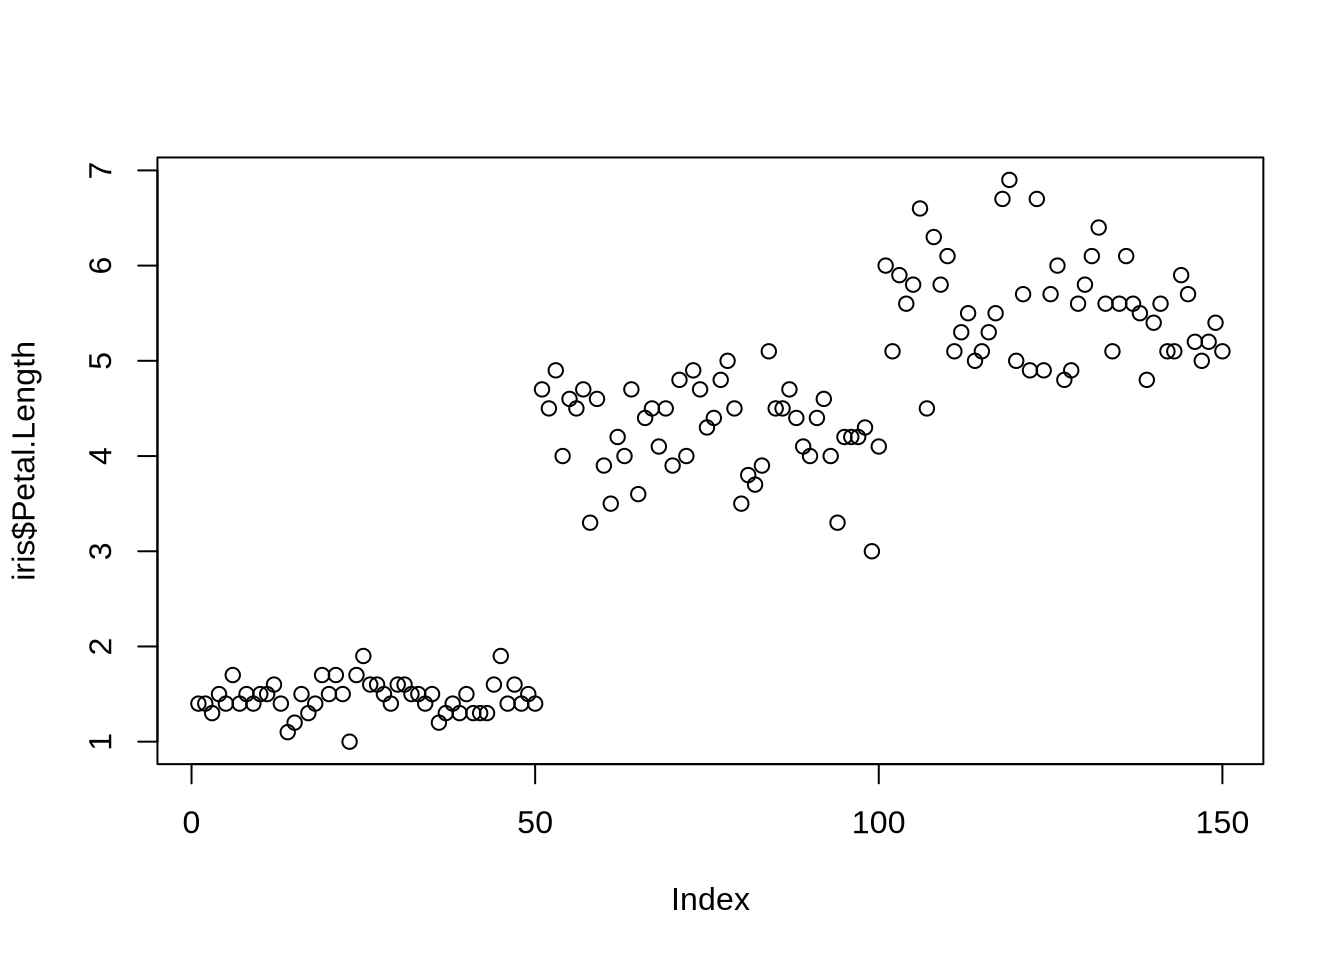
plot(iris$Petal.Length) # a plot at last. Simple, but many arguments: ?plot
Code
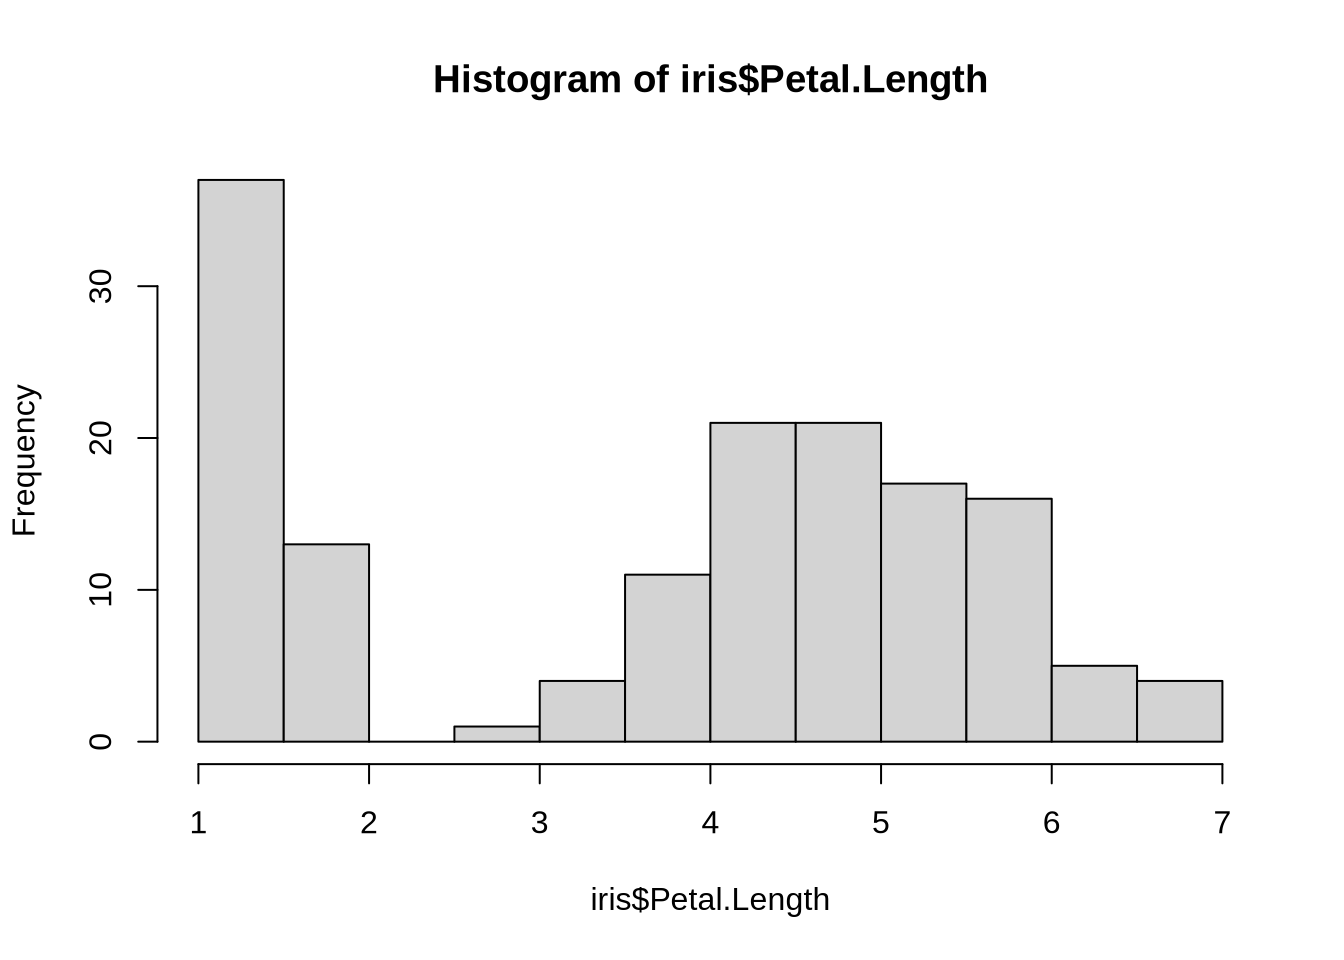
hist(iris$Petal.Length) # and a histogram
Task
hist() can have many arguments. Use help to find out how the histogram can be customized (e.g. number of break points, title, colors). Try some of it.
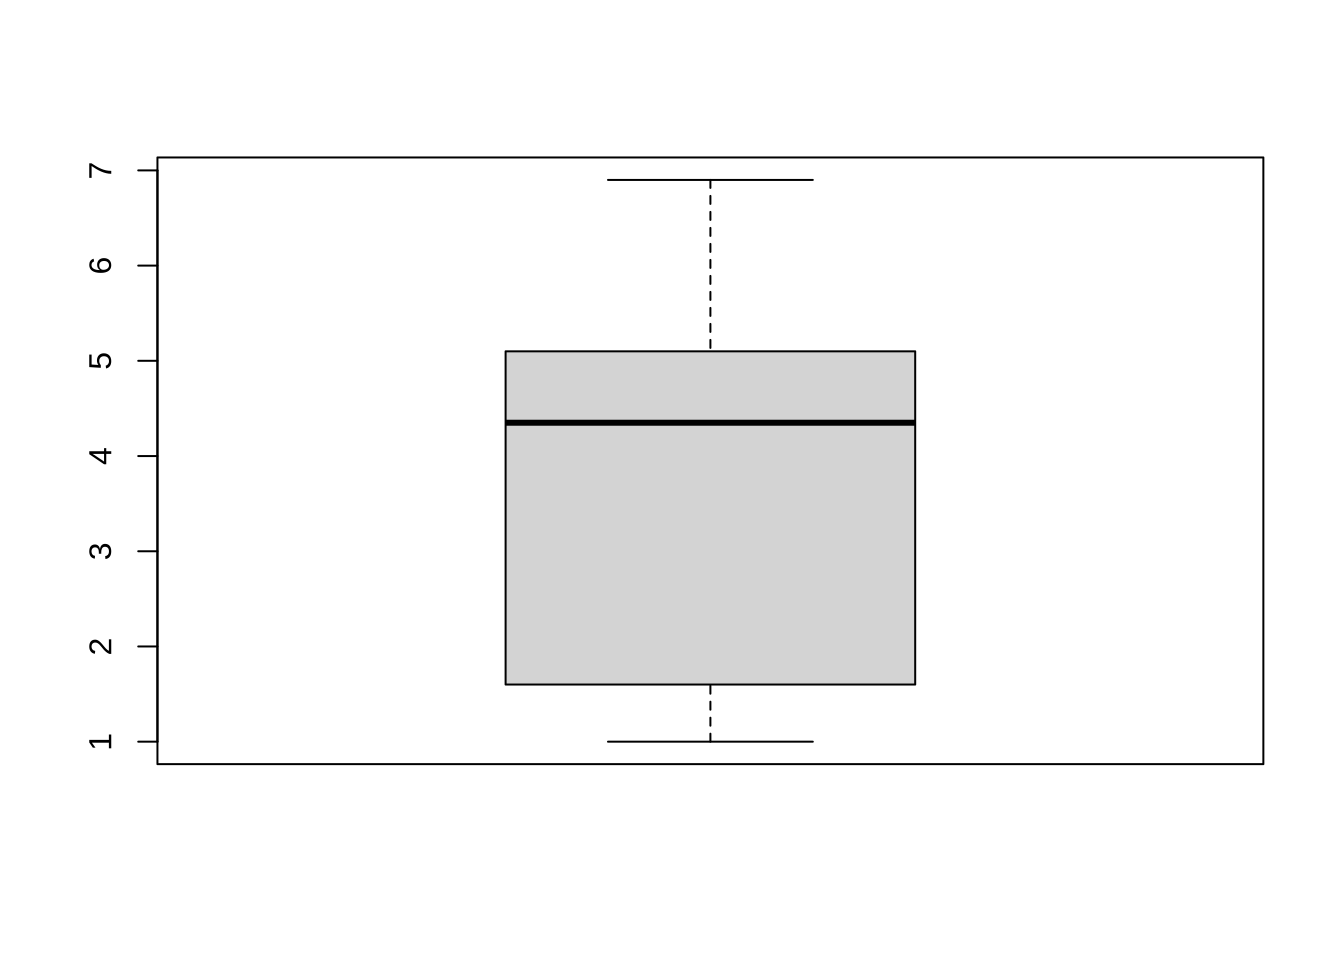
Boxplot: a more condensed summary
Code
boxplot(iris$Petal.Length)
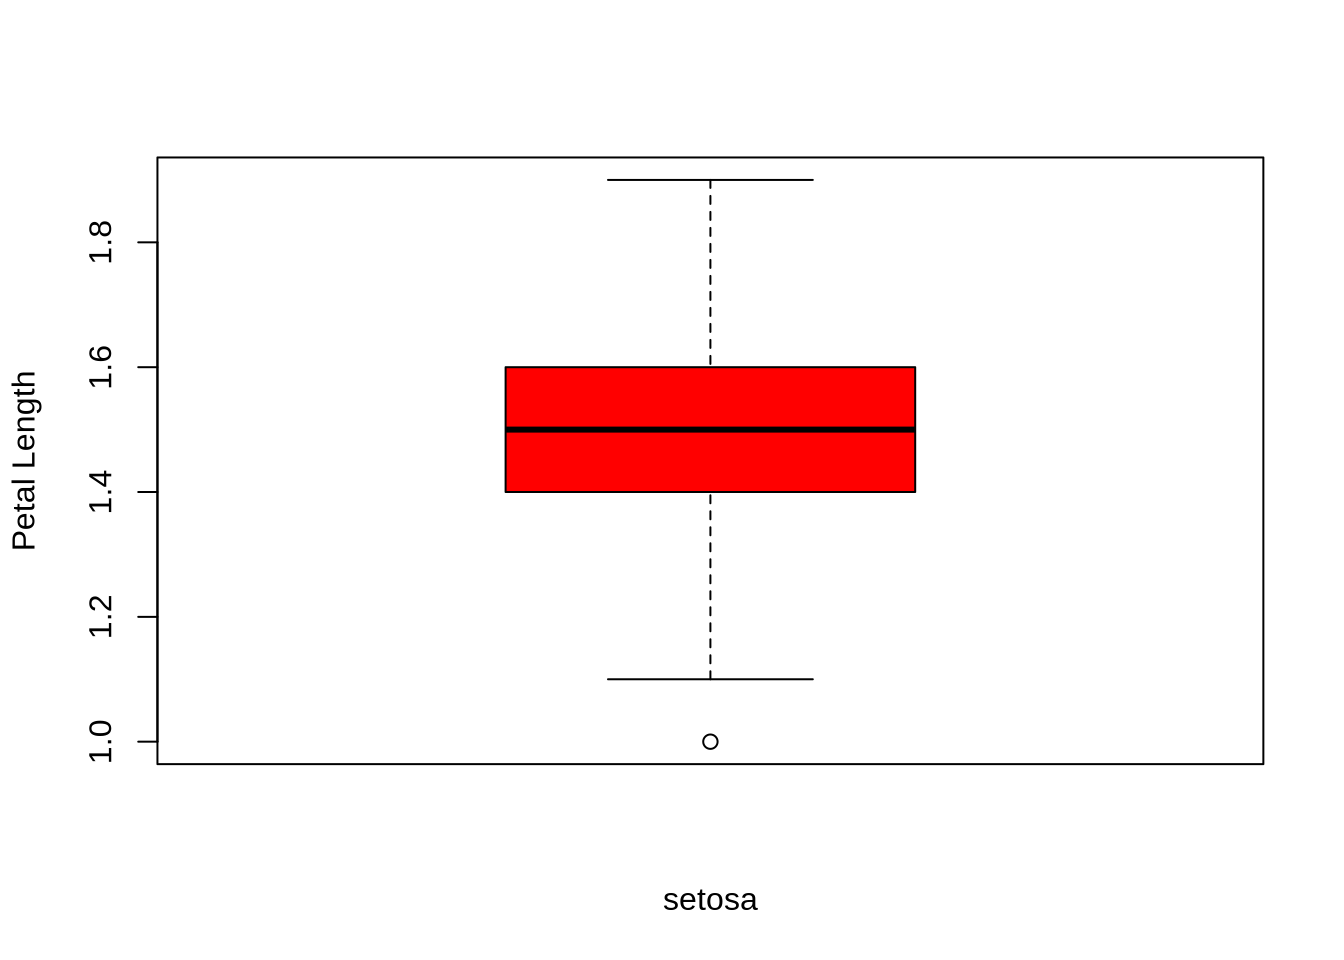
Task
The boxplot above is for all data. Create a boxplot of petal length for species “setosa” only.
Boxplot understands data frames
Code
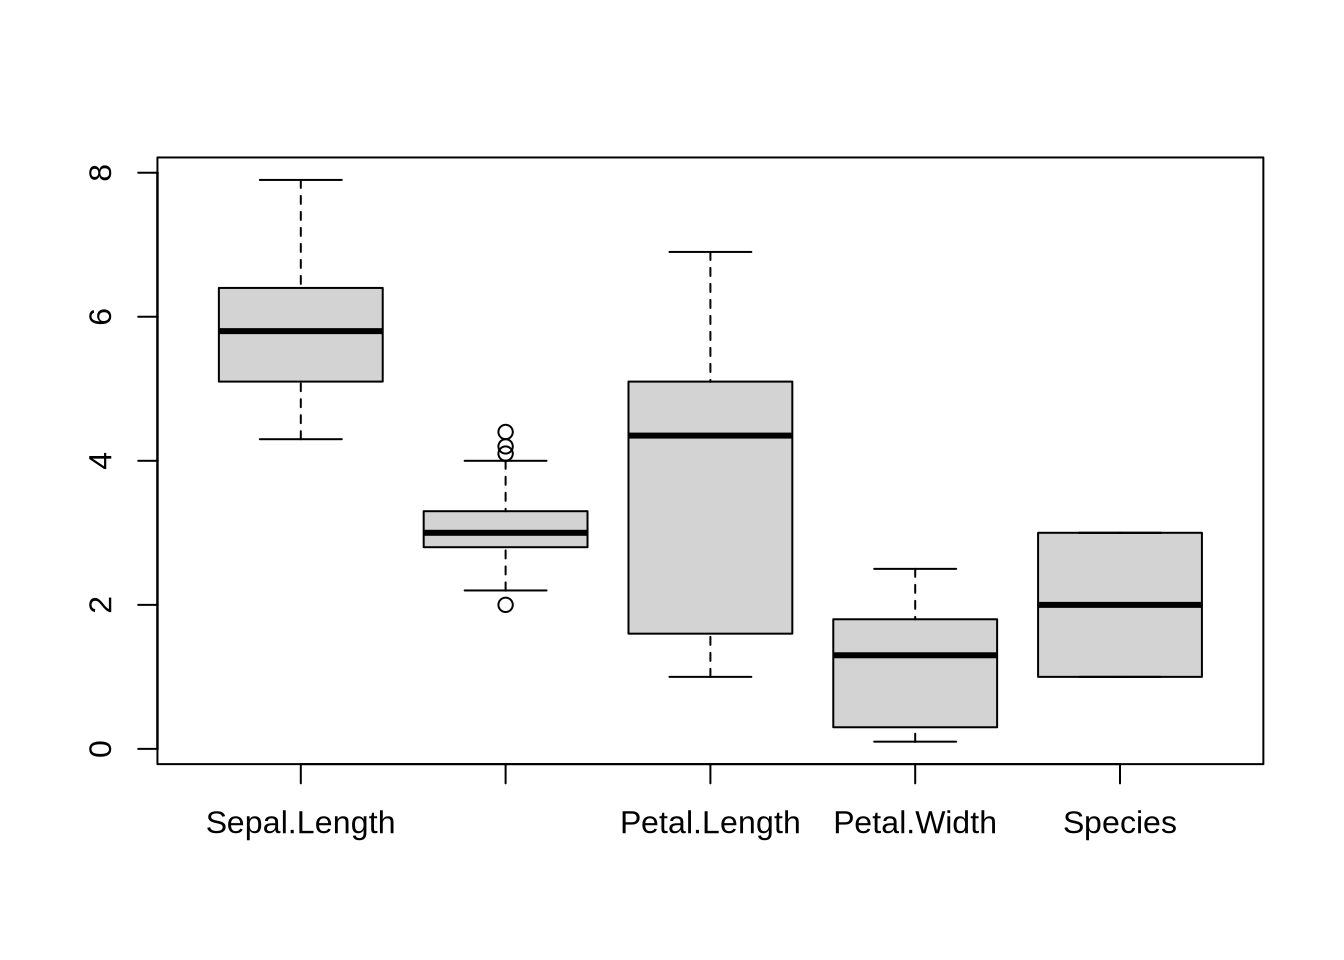
boxplot(iris)
Query: What does the boxplot for Species mean?
Interlude: Factors = categorical variables
Factors denote a special class of R-objects that can be thought of as categories (here: species). They have a given number of levels which are internally represented as integers.
Code
class(iris$Species)
[1] "factor"
Code
typeof(iris$Species)
[1] "integer"
Code
# a contigency table ~> histogram for categorical datatable(iris$Species)
    setosa versicolor  virginica
        50         50         50
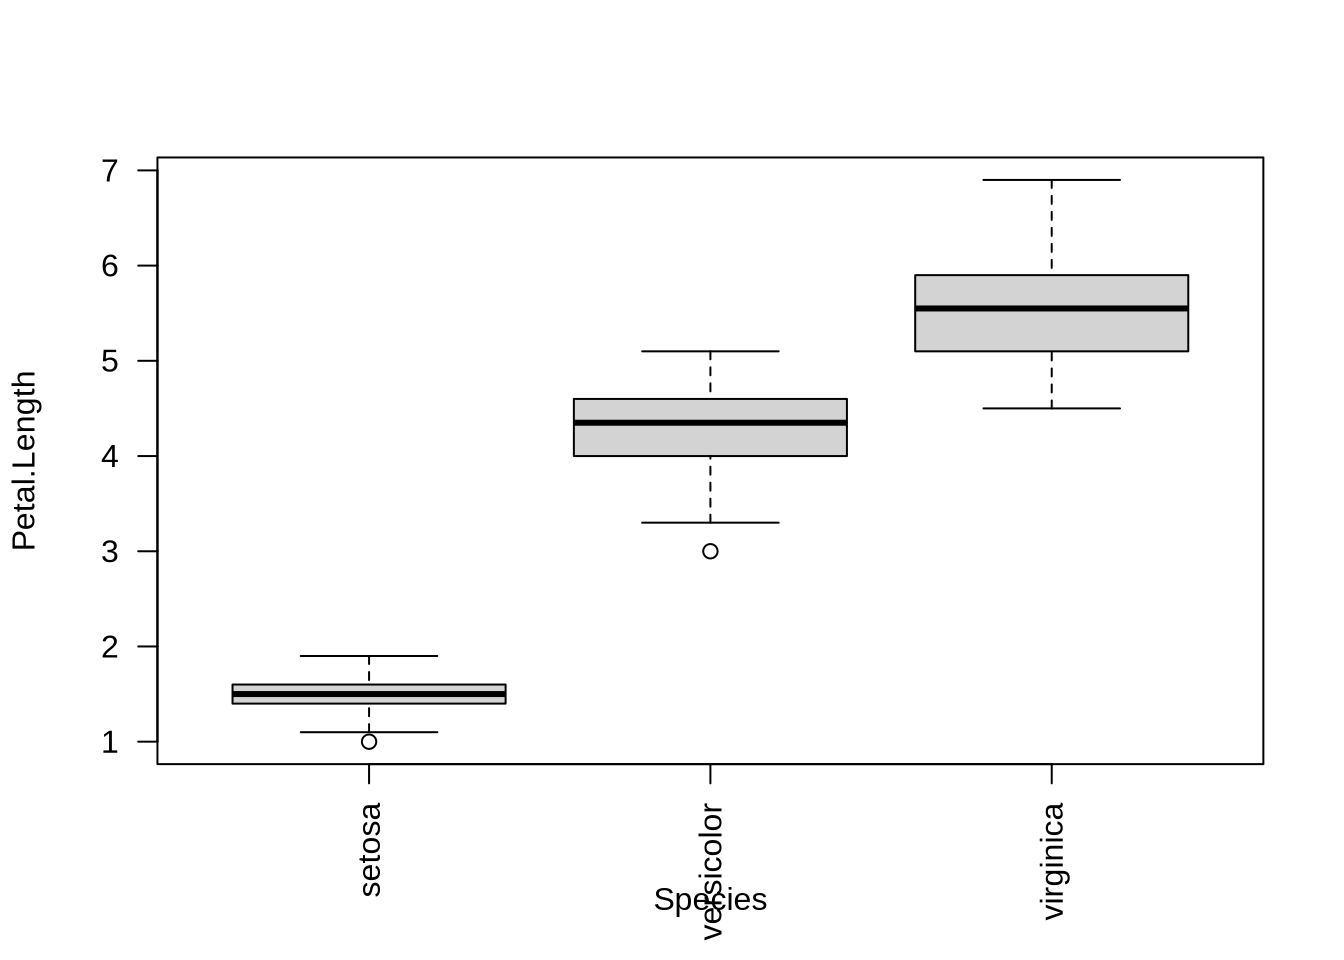
Boxplot understands factors in data frames
Code
boxplot( Petal.Length ~ Species, data = iris)
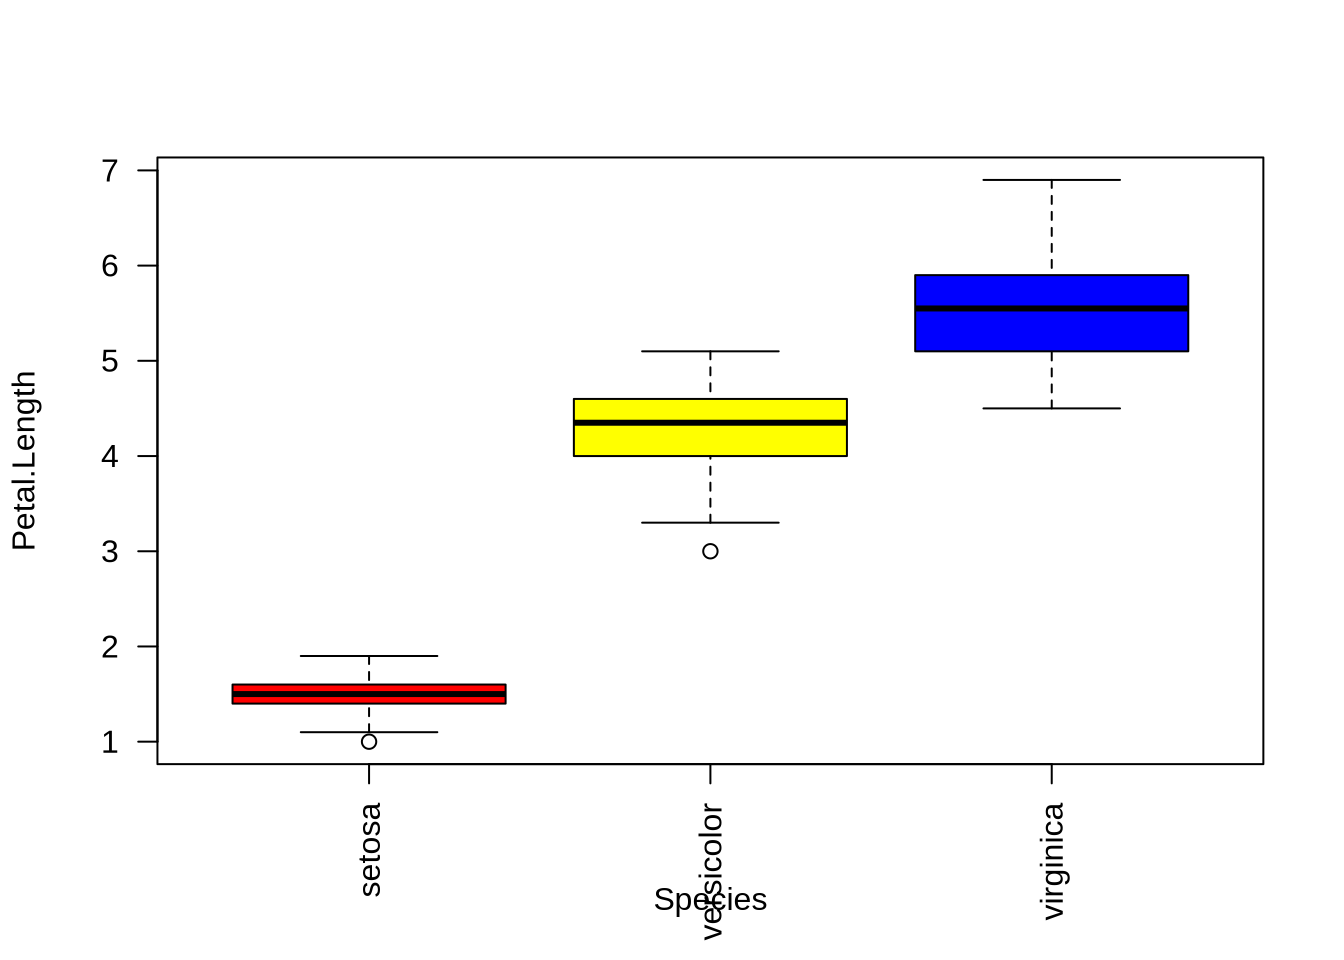
Task
Use help to add three different colors:
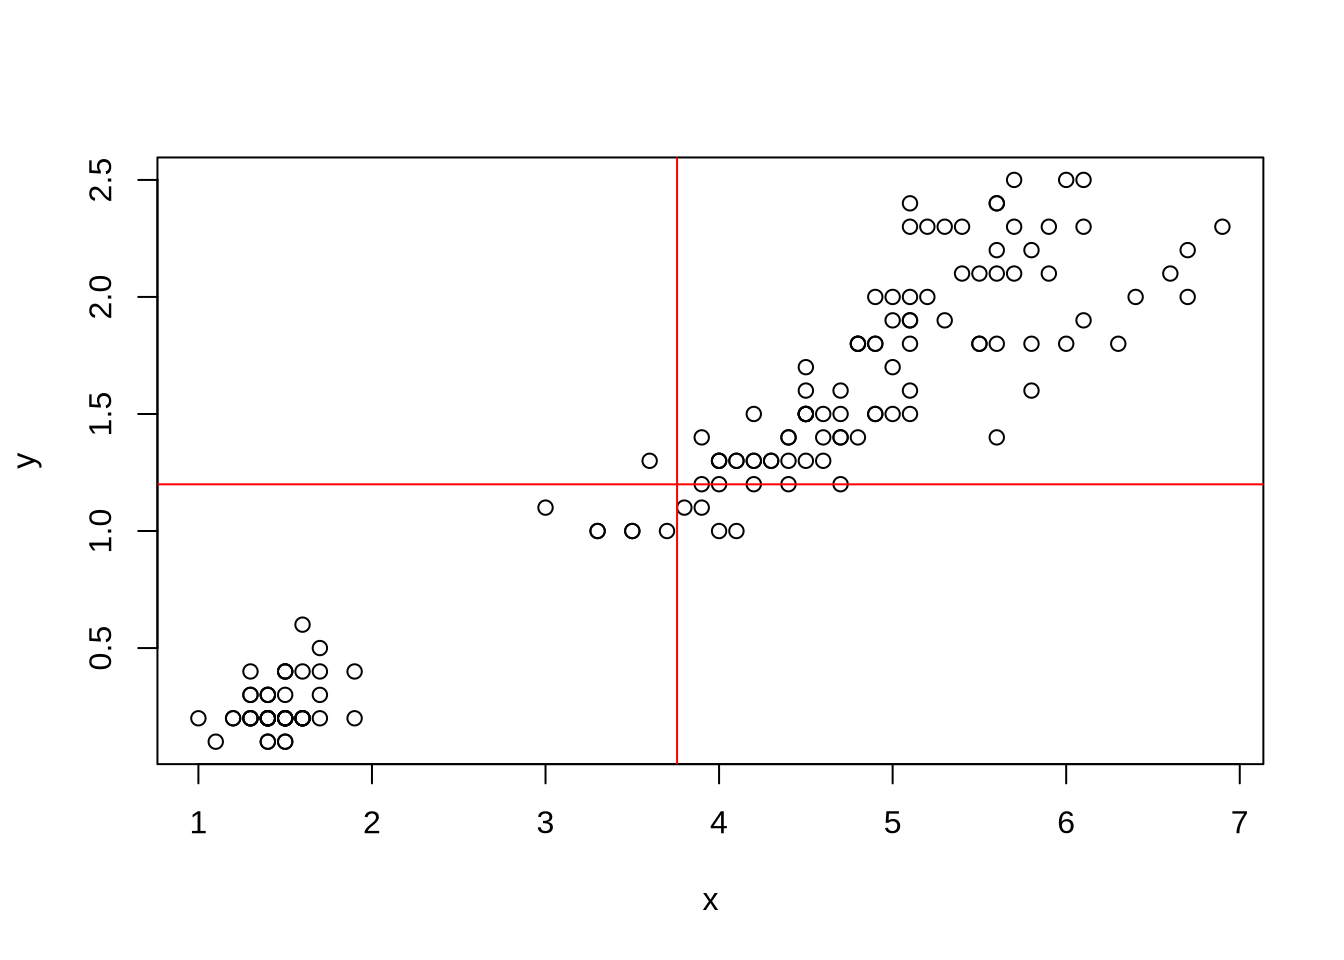
Correlations
If a data set has many numerical variables we often want to understand their correlations structure
Code
x=iris$Petal.Lengthy=iris$Petal.Widthplot(x,y) # again: this can be customizedabline(v=mean(x),h=mean(y),col="red") # add vertical/horizontal lines
Code
cor(x,y) # a correlation coefficient: which one?
[1] 0.9628654
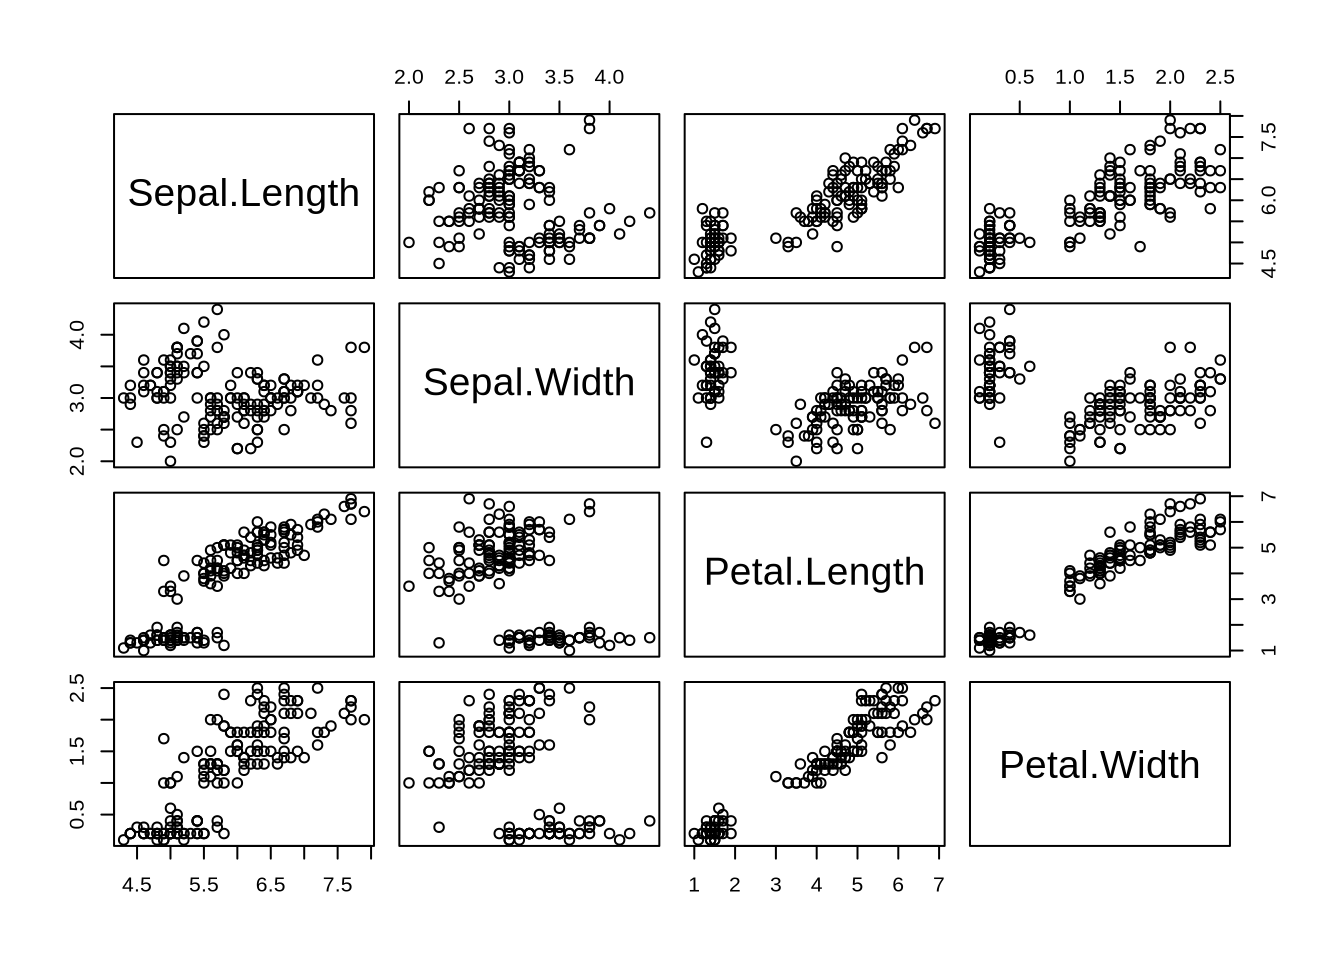
All-Against-All Correlations
Task
remove the Species variable from “iris” and store the result in a new data.frame “niris”
plot(niris) # provide a visualization for data frames, try also pairs(iris)
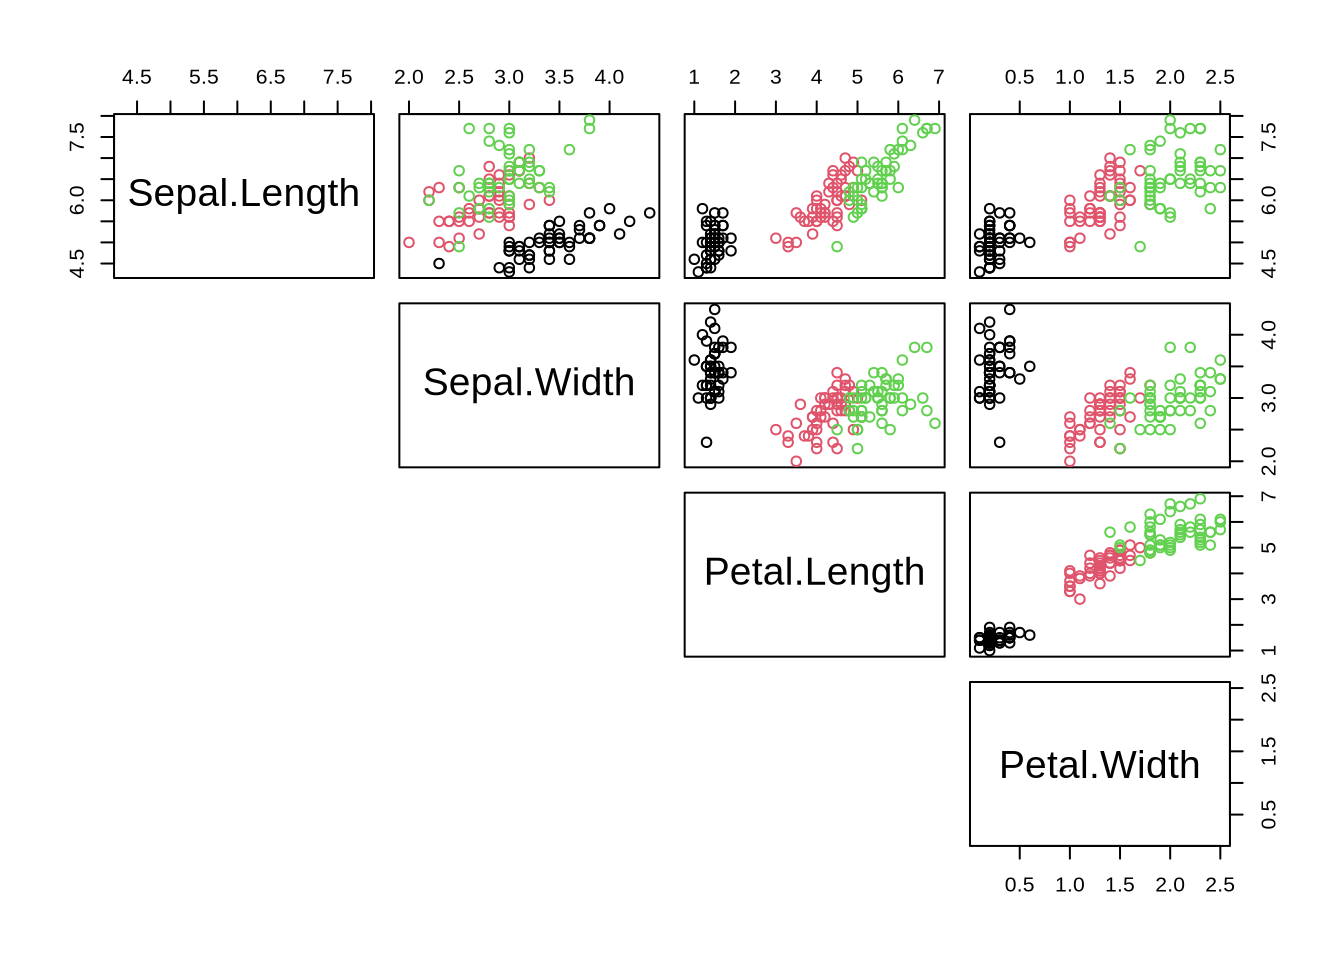
Code
# assign species-colors to each observation cols = iris$Species # understand how color is definedplot(niris, col=cols, lower.panel=NULL) # "cols" was defined in task above
Review
R markdown files extend scripts and can be converted to html/pdf
summary for descriptive statistics
simple plots with simple commands: plot(), hist(), …
lots of parameters for customization: line width, colours, …
correlation between variables: cor(), plot() - class specific behaviour
Notice that the data used was extremely clean and structured: data()
Source Code
---title: "04: Data Descriptions and Visualizations"author: "Thomas Manke"categories: - markdown - hist() - cor() - boxplot()---```{r, child="_setup.qmd"}```## Descriptive Statistics```{r descriptive}summary(iris)plot(iris$Petal.Length) # a plot at last. Simple, but many arguments: ?plot hist(iris$Petal.Length) # and a histogram```#### Task hist() can have many arguments. Use help to find out how the histogram can be customized (e.g. number of break points, title, colors). Try some of it.## Boxplot: a more condensed summary```{r}boxplot(iris$Petal.Length)```#### Task The boxplot above is for *all* data. Create a boxplot of petal length for species "setosa" only.```{r boxplot, echo=FALSE}boxplot(iris$Petal.Length[iris$Species=="setosa"], xlab="setosa", ylab="Petal Length", col="red")```Boxplot understands data frames```{r}boxplot(iris) ```**Query**: What does the boxplot for Species mean?## Interlude: Factors = categorical variablesFactors denote a special class of R-objects that can be thought of as categories (here: species). They have a given number of *levels* which are internally represented as integers.```{r factors}class(iris$Species)typeof(iris$Species)# a contigency table ~> histogram for categorical datatable(iris$Species) ```***Boxplot understands factors in data frames```{r boxplot_factors}boxplot( Petal.Length ~ Species, data = iris)```#### Task Use help to add three different colors:```{r colored_boxplot, echo=FALSE}# use help to determine how to add colorscols=c("red","yellow","blue")boxplot( Petal.Length ~ Species, data = iris, las=2,col=cols)```## CorrelationsIf a data set has many numerical variables we often want to understand their correlations structure```{r corr}x=iris$Petal.Lengthy=iris$Petal.Widthplot(x,y) # again: this can be customizedabline(v=mean(x),h=mean(y),col="red") # add vertical/horizontal linescor(x,y) # a correlation coefficient: which one?```## All-Against-All Correlations#### Taskremove the Species variable from "iris" and store the result in a new data.frame "niris"```{r niris, echo=FALSE}niris=iris[,-5] # generate new data frame without species variablestr(niris)``````{r all_against_all}cor(niris) # correlation matrix. Which correlation coefficient?plot(niris) # provide a visualization for data frames, try also pairs(iris)# assign species-colors to each observation cols = iris$Species # understand how color is definedplot(niris, col=cols, lower.panel=NULL) # "cols" was defined in task above```***## Review* R markdown files extend scripts and can be converted to html/pdf* summary for descriptive statistics* simple plots with simple commands: plot(), hist(), ...* lots of parameters for customization: line width, colours, ...* correlation between variables: cor(), plot() - class specific behaviour* Notice that the data used was extremely clean and structured: data()