deseq2 - applied
Bioinfo-Core @ MPI-IE
Wed Jun 25 06:56:14 2025
Goals: Apply what was learned through the course.
- repeat: generating DESeq-object (data, metadata, design)
- Initial QC and visualisation.
- Run the DESeq workflow
- Interpret some of the results
1. Introduction
Background:
We are looking in murine bone marrow cells. More specifically, the stem- and multipotent progenitor cells. A (very expensive) experiment was set up, and there is RNA-seq data available three cellTypes:
- HSCs
- MPP1
- MPP2
collected from both young and aged mice. You and your lab are eager to see:
- Did the experiment work ?
- What are the effects of aging on the different cell populations ?
Hint: a list of cell-cycle genes (KEGG) are available under:
data/genesets/KEGG_cellcycle.txt
Dataset: MPP Note that this is publically available data under GEO accession ID GSE162607 with DOI: 10.1038/s41467-022-30440-2.
with count matrix and meta data:
data/mpp/mpp_counts.tsv
data/mpp/mpp_meta.tsv
Note: rownames in the count object are lowercase-capitalized, the KEGG_cellcycle ones are fully capitalized).
Good luck and have fun!
2. Let’s go.
a. Libraries, data & factors
library("DESeq2")
library("ashr")
library("tidyverse")
library("pheatmap")
library("UpSetR")

source('funcs.R')
Read in the data.
dfile <- "data/mpp/mpp_counts.tsv"
data <- read_tsv(file=dfile)
data <- data %>% column_to_rownames("gene_id")

mfile <- "data/mpp/mpp_meta.tsv"
metadata <- read_tsv(file=mfile)
metadata <- metadata %>% column_to_rownames("sample")
metadata$condition <- as.factor(metadata$condition)
metadata$celltype  <- as.factor(metadata$celltype)
Check our factors !
print(metadata$celltype)## [1] HSC HSC MPP1 MPP1 MPP2 MPP2 HSC HSC MPP1 MPP1 MPP2 MPP2
## Levels: HSC MPP1 MPP2print(metadata$condition)## [1] Young Young Young Young Young Young Aged Aged Aged Aged Aged Aged
## Levels: Aged Youngmetadata %>% table## condition
## celltype Aged Young
## HSC 2 2
## MPP1 2 2
## MPP2 2 2Relevel factors !
levels(metadata$condition) <- c("Young","Aged")
print(metadata$condition)
## [1] Aged Aged Aged Aged Aged Aged Young Young Young Young Young Young
## Levels: Young Agedb. Build DESeq object.
dds <- DESeqDataSetFromMatrix(countData=data,
                              colData=metadata,
                              design = ~celltype*condition
                              )
c. plotPCA
dds %>% PCA_tm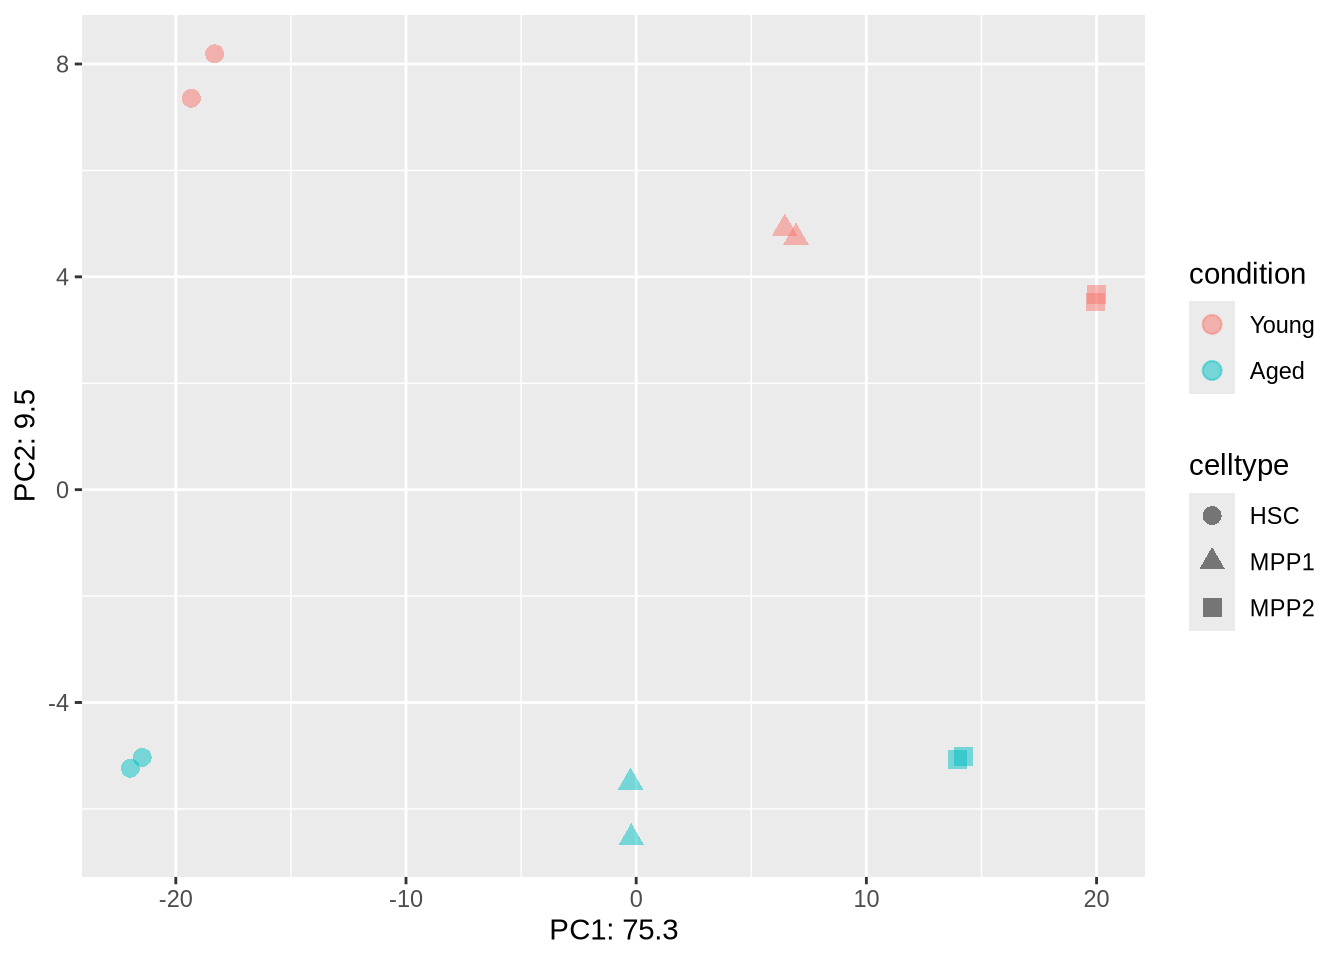
d. filter
rs <- dds %>% counts %>% rowSums()
dds <- dds[rs>1,]
e. run DESeq2
dds <- DESeq(dds)f. sizeFactors & dispersion
sizeFactors(dds)## Young_HSC_1 Young_HSC_2 Young_MPP1_1 Young_MPP1_2 Young_MPP2_1 Young_MPP2_2
## 0.8741664 1.0907894 1.0501099 1.0596767 0.9307710 0.9863305
## Aged_HSC_1 Aged_HSC_2 Aged_MPP1_1 Aged_MPP1_2 Aged_MPP2_1 Aged_MPP2_2
## 0.9004813 1.0741130 0.9827498 1.1019995 1.0009257 1.0478315plotDispEsts(dds)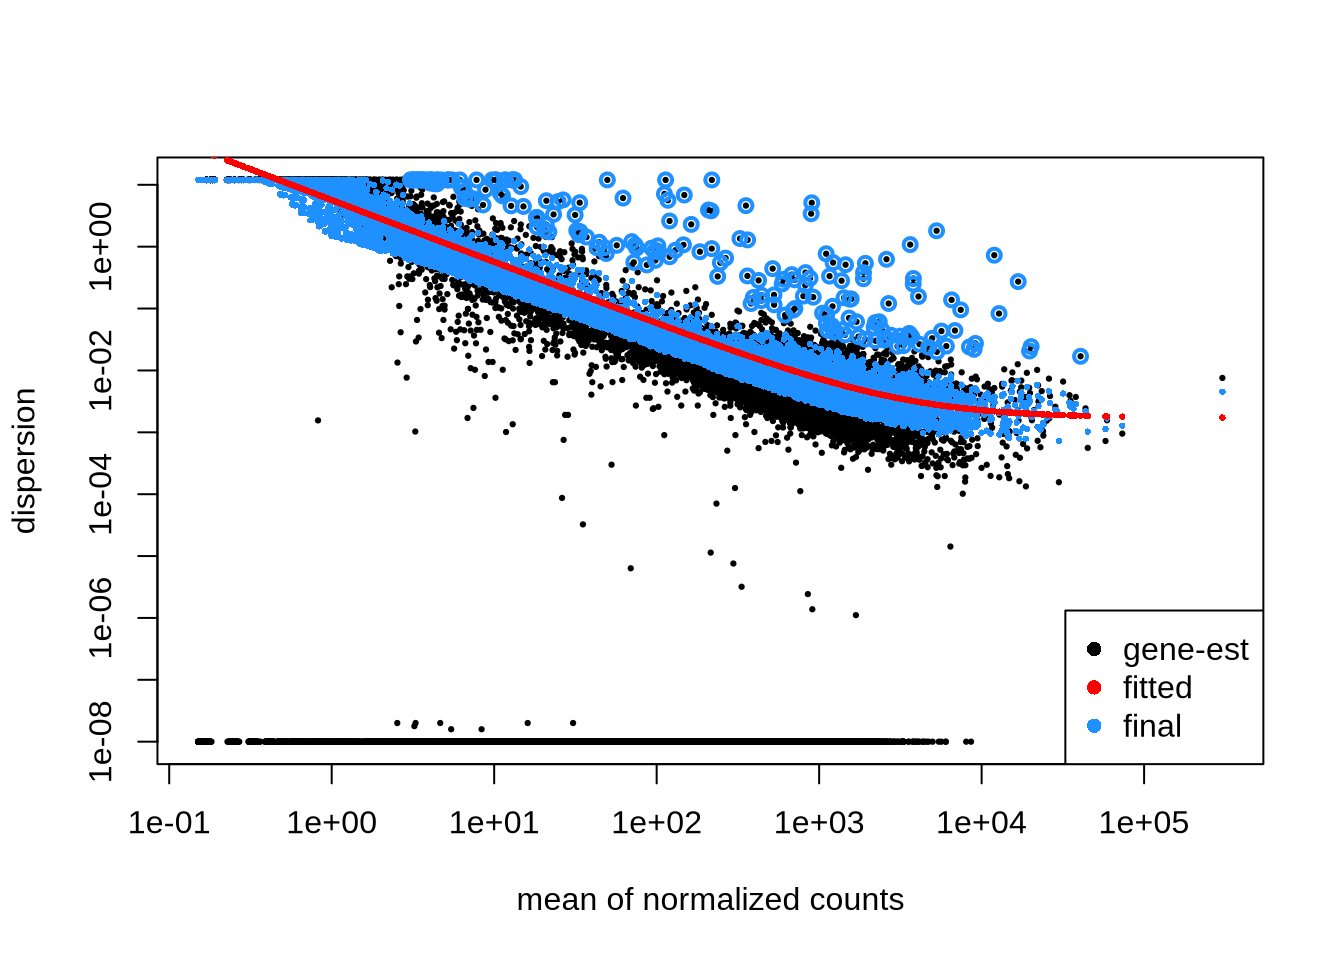
g. LRT for age.
# which model are we interested in as reduced?
dds_lrt <- DESeq(dds, test="LRT", reduced = ~celltype)
res_lrt <- results(dds_lrt)
h. results.
cleanDF <- function(RESobj){
RESdf <- data.frame(RESobj) %>%
drop_na() %>%
arrange(padj)
return(RESdf)
}
res_lrt_clean <- cleanDF(res_lrt)
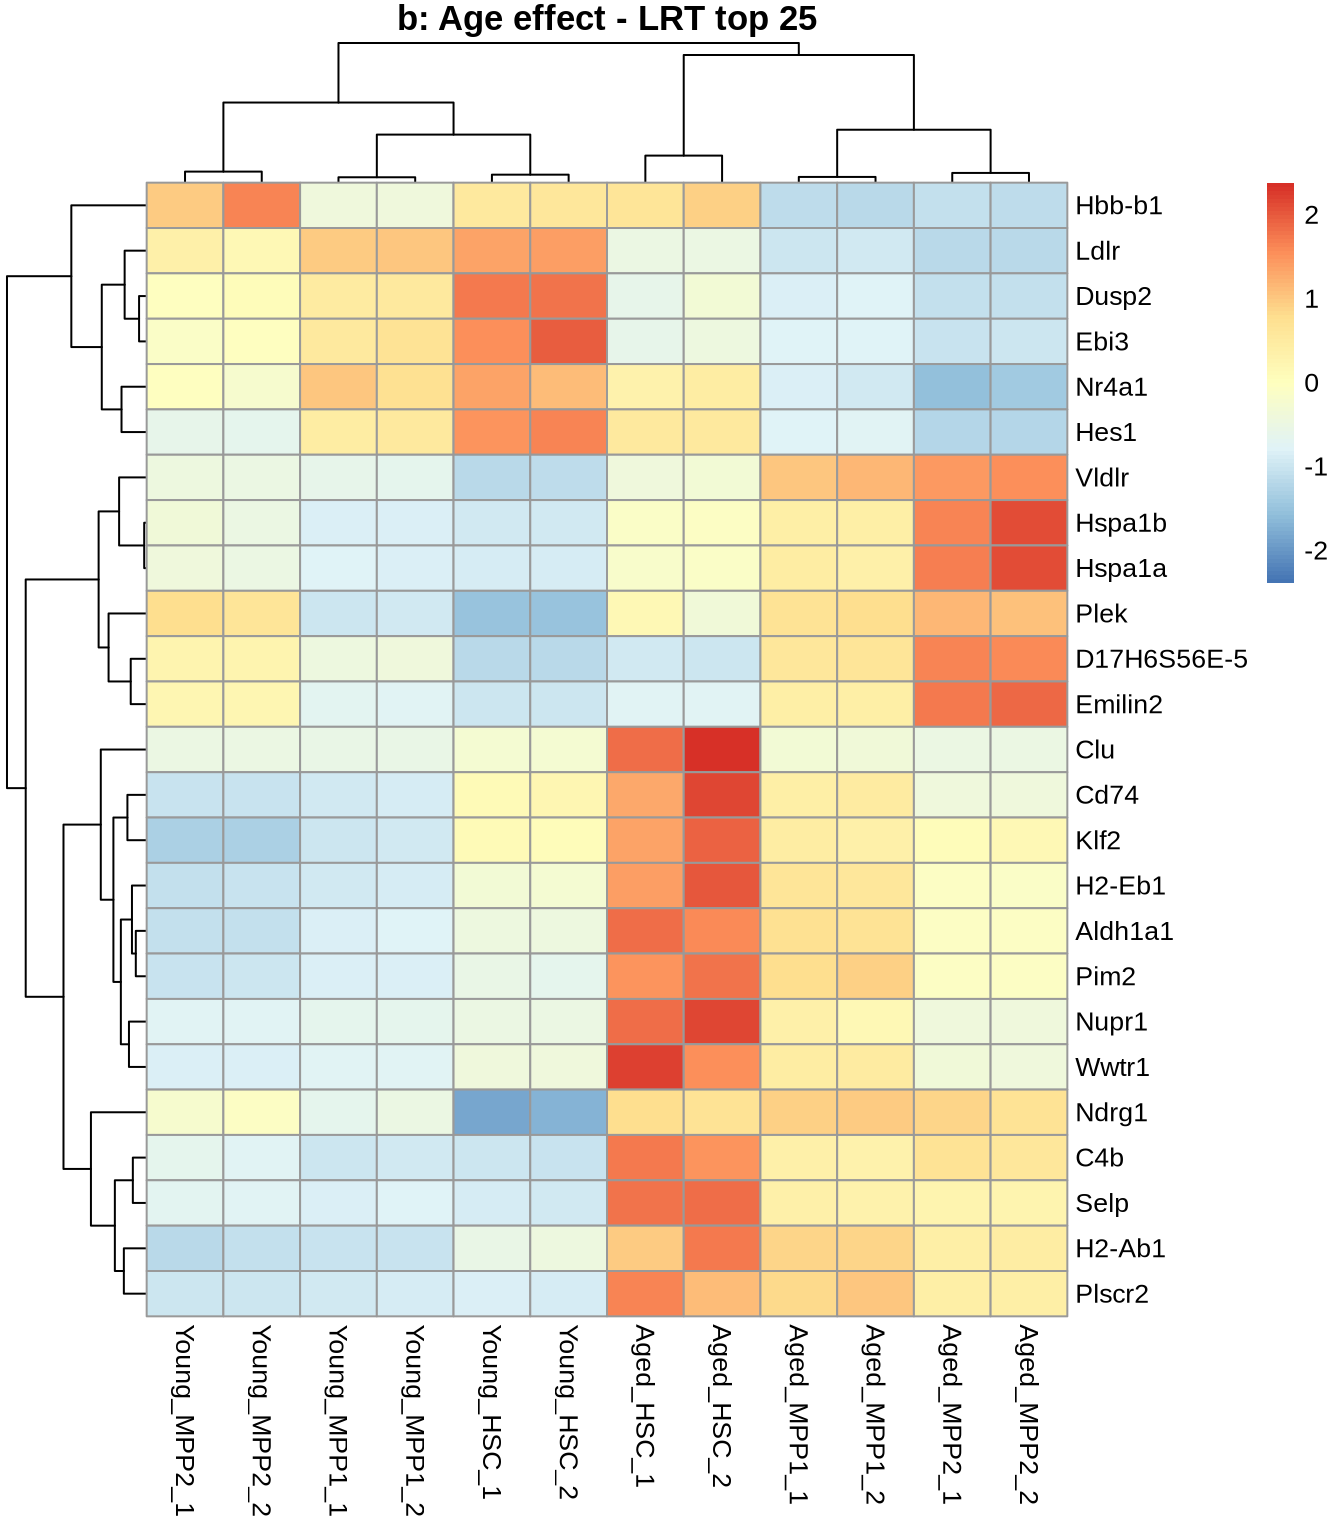
head(res_lrt_clean)i. Look at the LRT results
Top 25 for sanity check:
normcounts <- counts(dds, normalized=TRUE) %>% data.frame()
top_25_genes <- res_lrt_clean %>% arrange(padj) %>% head(25) %>% rownames()
pheatmap(
  normcounts %>% subset(rownames(.) %in% top_25_genes),
  scale = 'row',
  main='Age effect - LRT top 25'
)
pheatmap(
  normcounts %>% dplyr::filter(rownames(.) %in% top_25_genes),
  scale = 'row',
  main='b: Age effect - LRT top 25'
)
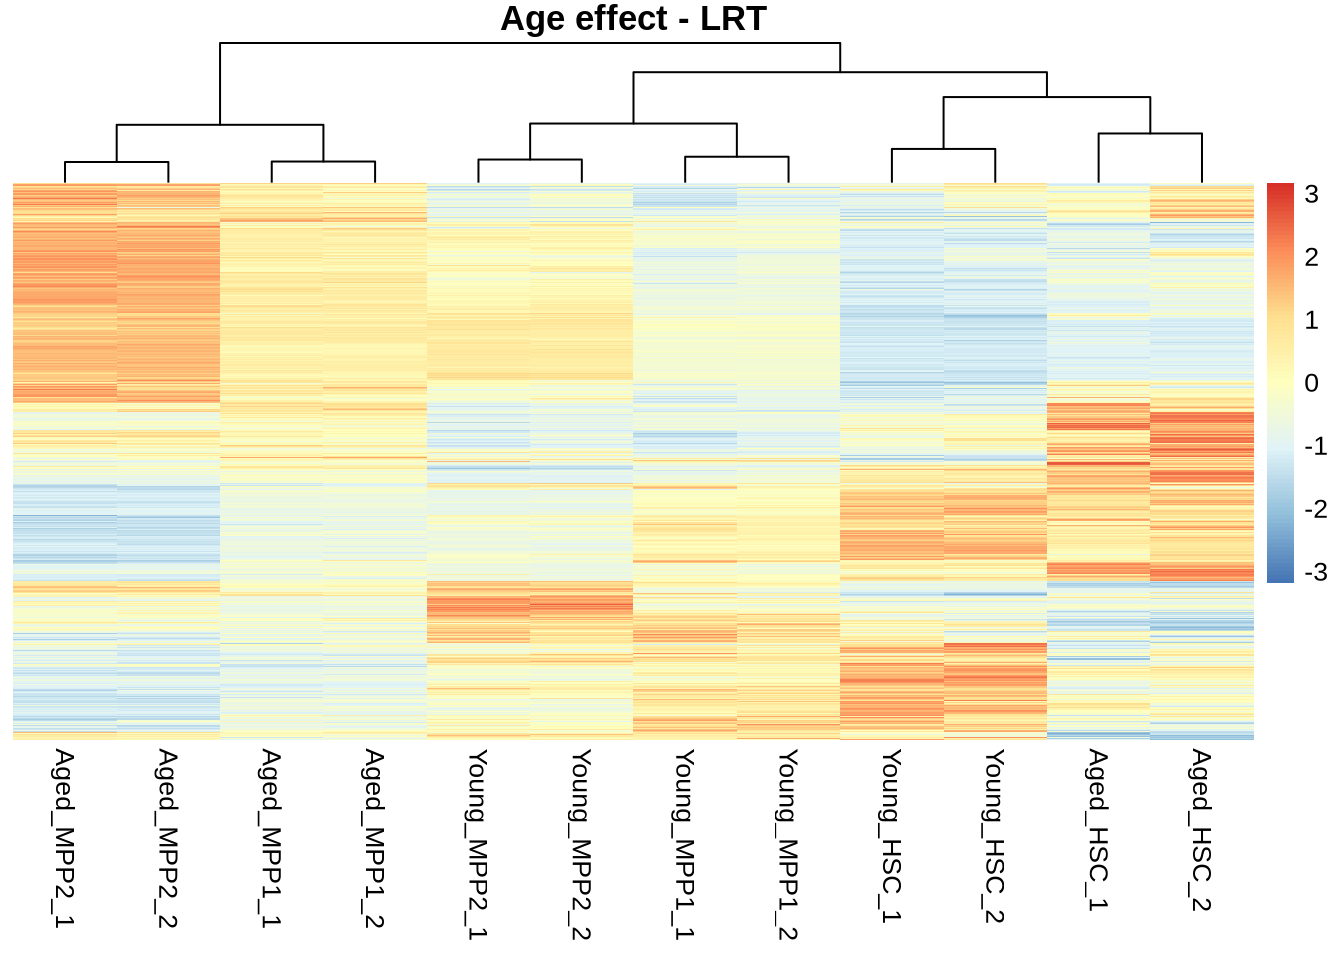
All “signifcant”
normcounts %>%
  subset(rownames(normcounts) %in% rownames(res_lrt_clean %>% subset(padj < 0.05))) %>%
  pheatmap(
    scale = 'row',
    main='Age effect - LRT',
    show_rownames = FALSE,
    treeheight_row = 0
    )
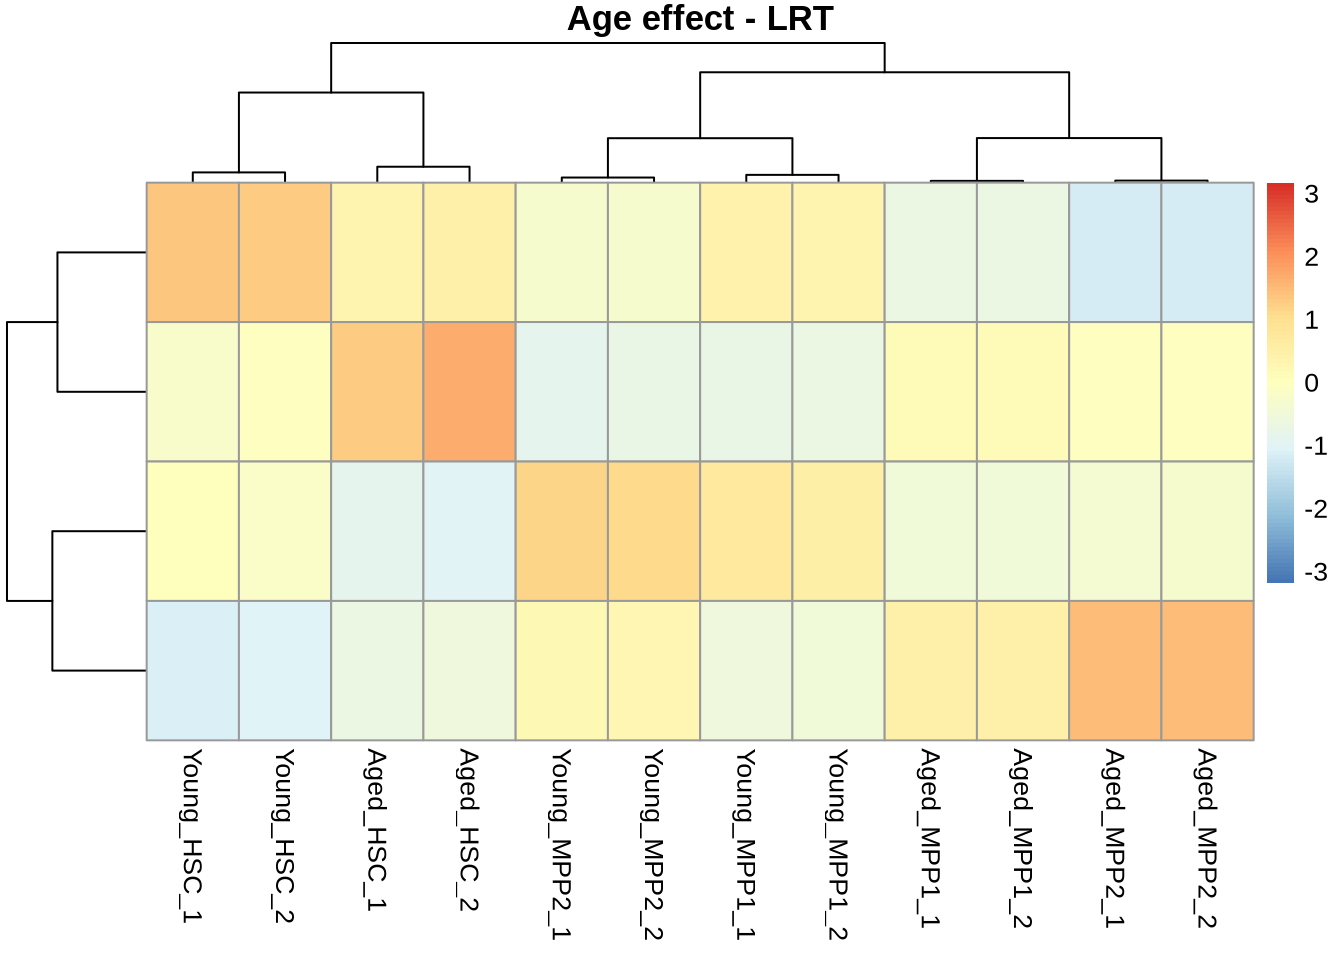
Make clusters
normcounts %>%
  subset(rownames(normcounts) %in% rownames(res_lrt_clean %>% subset(padj < 0.05))) %>%
  pheatmap(
    scale = 'row',
    kmeans_k = 4,
    main='Age effect - LRT',
    show_rownames = FALSE
  )
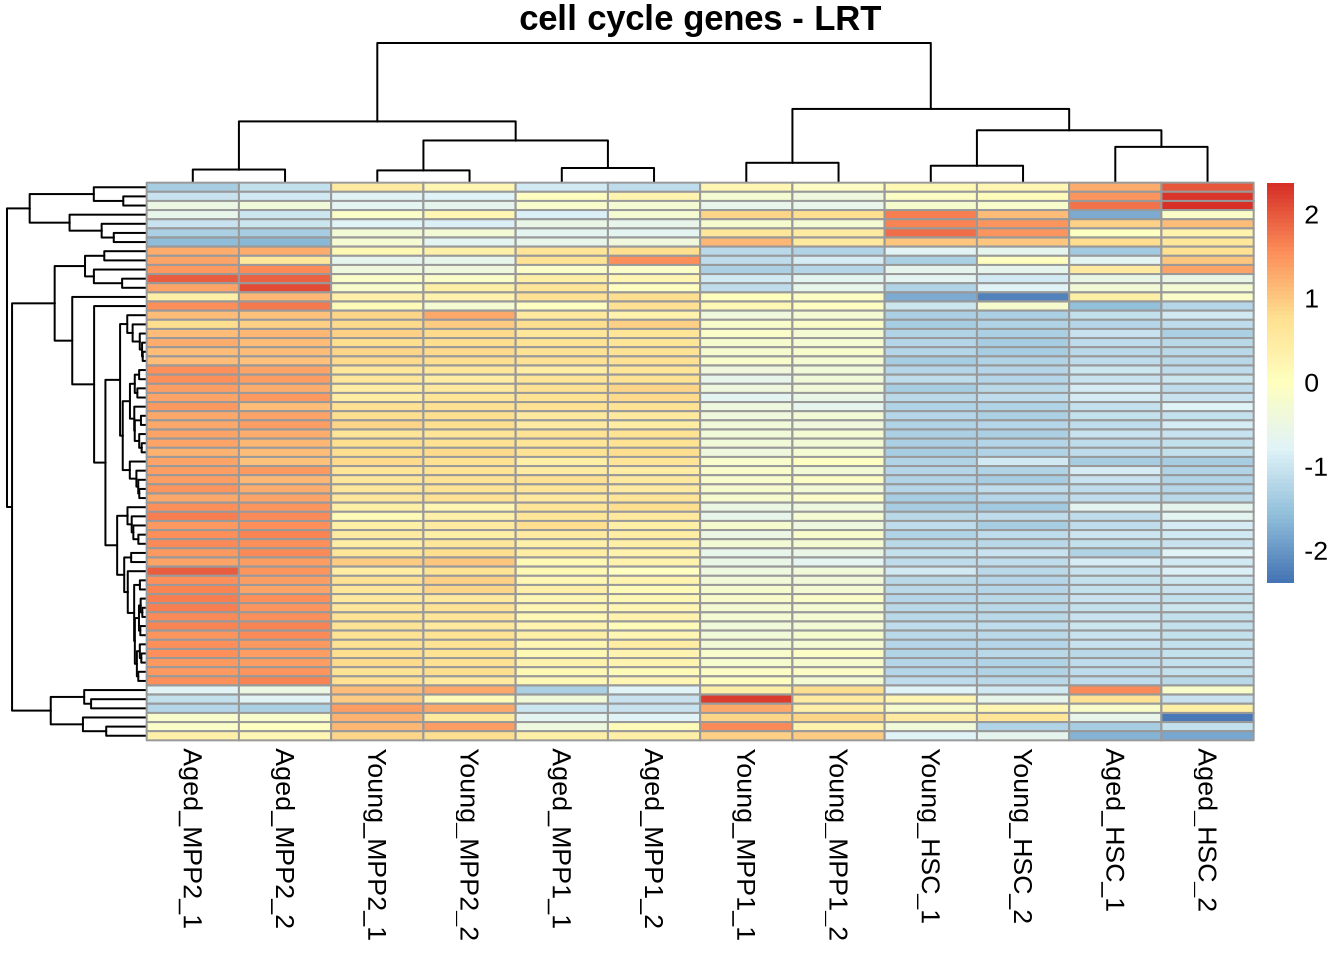
Overlap with pre-defined group:
# Get cell cycle genes.
ccf <- "data/genesets/KEGG_cellcycle.txt"
cellcycle <- read_tsv(file=ccf, col_names=FALSE)

# character vector  of cellcycle genes with proper naming convention
cellcycle <- cellcycle$X1 %>% str_to_title()

res_lrt_clean_cycle <- res_lrt_clean %>%
  dplyr::filter(rownames(res_lrt_clean) %in% cellcycle) %>%
  dplyr::filter(padj < 0.05)

normcounts %>%
  dplyr::filter(rownames(normcounts) %in% rownames(res_lrt_clean_cycle)) %>%
  pheatmap(
    scale = 'row',
    main='cell cycle genes - LRT',
    show_rownames = FALSE
  )
i. Pairwise comparisons for age effect under different celltypes
# Remember our base levels and our coefficients.
print(resultsNames(dds))
## [1] "Intercept" "celltype_MPP1_vs_HSC"
## [3] "celltype_MPP2_vs_HSC" "condition_Aged_vs_Young"
## [5] "celltypeMPP1.conditionAged" "celltypeMPP2.conditionAged"# Get our pair-wise comparisons. Note we immediately clean up our results.
# Remember our matrix Trick!
mod_mat <- model.matrix(design(dds), colData(dds))
HSC_young <- colMeans(mod_mat[dds$celltype == 'HSC' & dds$condition == "Young",])
HSC_old <- colMeans(mod_mat[dds$celltype == 'HSC' & dds$condition == "Aged",])
MPP1_young <- colMeans(mod_mat[dds$celltype == 'MPP1' & dds$condition == "Young",])
MPP1_old <- colMeans(mod_mat[dds$celltype == 'MPP1' & dds$condition == "Aged",])
MPP2_young <- colMeans(mod_mat[dds$celltype == 'MPP2' & dds$condition == "Young",])
MPP2_old <- colMeans(mod_mat[dds$celltype == 'MPP2' & dds$condition == "Aged",])
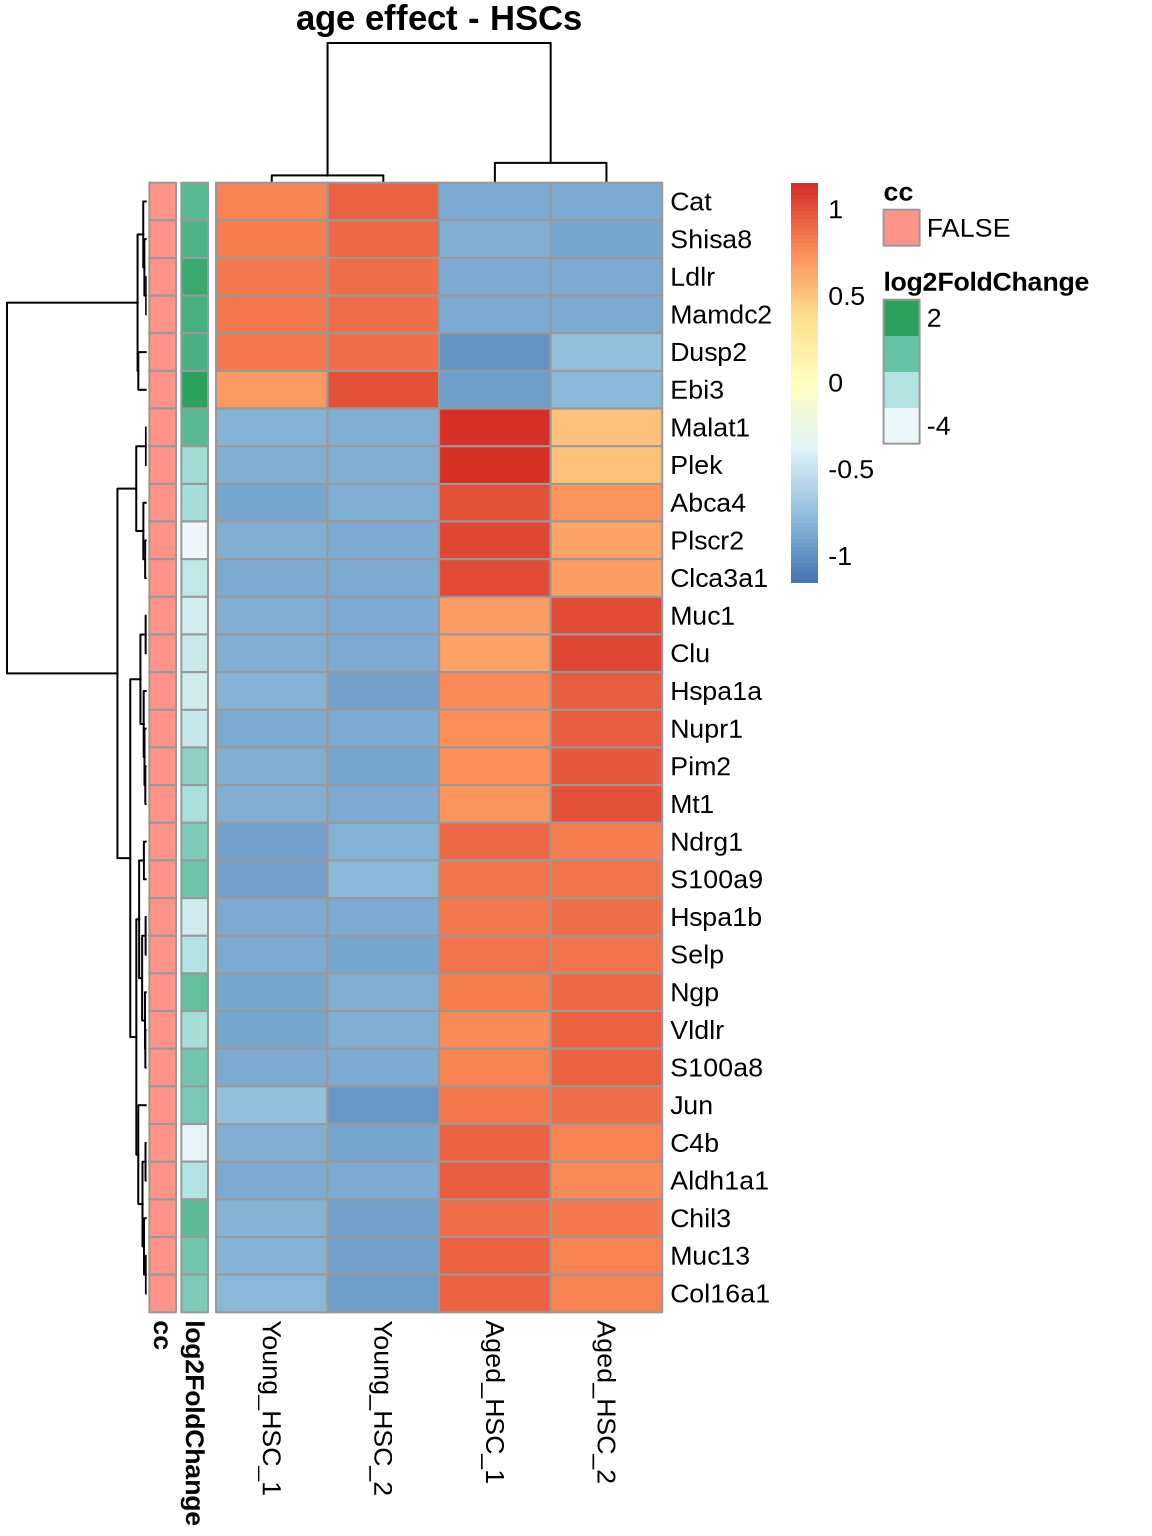
# The easiest to fetch is the age effect in HSC cells.
ageEffect_HSC <- cleanDF( lfcShrink(dds, contrast = HSC_old-HSC_young , type="ashr") )
# Now let's get the age effect in MPP1 cells. (Which is the condition effect + our interaction term).
ageEffect_MPP1 <- cleanDF( lfcShrink(dds, contrast = MPP1_old-MPP1_young, type='ashr') )
# Lastly, let's get the age effect in MPP1 cells.
ageEffect_MPP2 <- cleanDF( lfcShrink(dds, contrast = MPP2_old-MPP2_young, type='ashr') )# top
nt <- 30
tops <- ageEffect_HSC %>% head(nt) %>% rownames
cts <- normcounts %>% dplyr::select(contains('HSC')) %>% subset(rownames(.) %in% tops)
ann <- ageEffect_MPP1[tops, c('log2FoldChange'), drop=FALSE]
ann <- ann %>% mutate(cc = as.character(rownames(.) %in% cellcycle))
cts %>% pheatmap(
scale = 'row',
main='age effect - HSCs',
show_rownames = TRUE,
annotation_row = ann
)
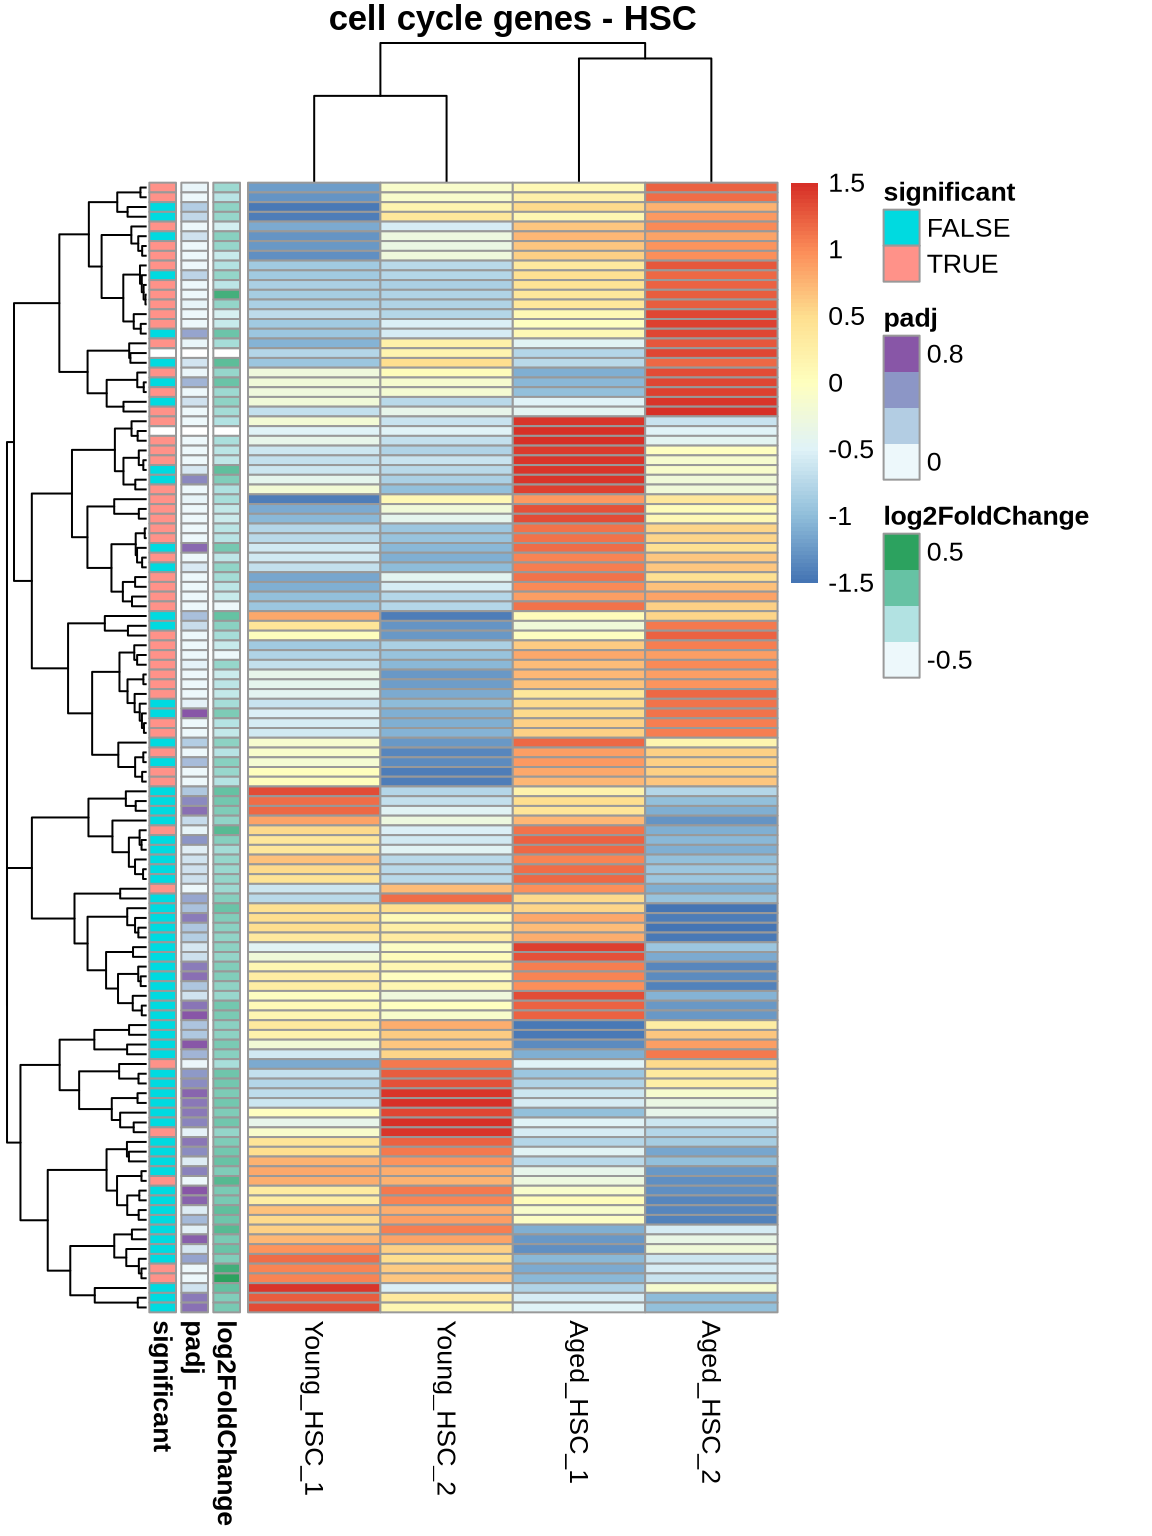
# cell cycle genes (all)
cts <- normcounts %>%
  dplyr::select(contains('HSC')) %>%
  subset(rownames(.) %in% cellcycle) %>%
  dplyr::filter(rowSums(.) > 1)

ann <- ageEffect_MPP1[rownames(cts), c('log2FoldChange','padj'), drop=FALSE]
ann <- ann %>% mutate(significant = factor(ifelse(padj < 0.05, 'TRUE', 'FALSE')))

cts %>%
  pheatmap(
  scale = 'row',
  main='cell cycle genes - HSC',
  show_rownames = FALSE,
  annotation_row = ann
  )
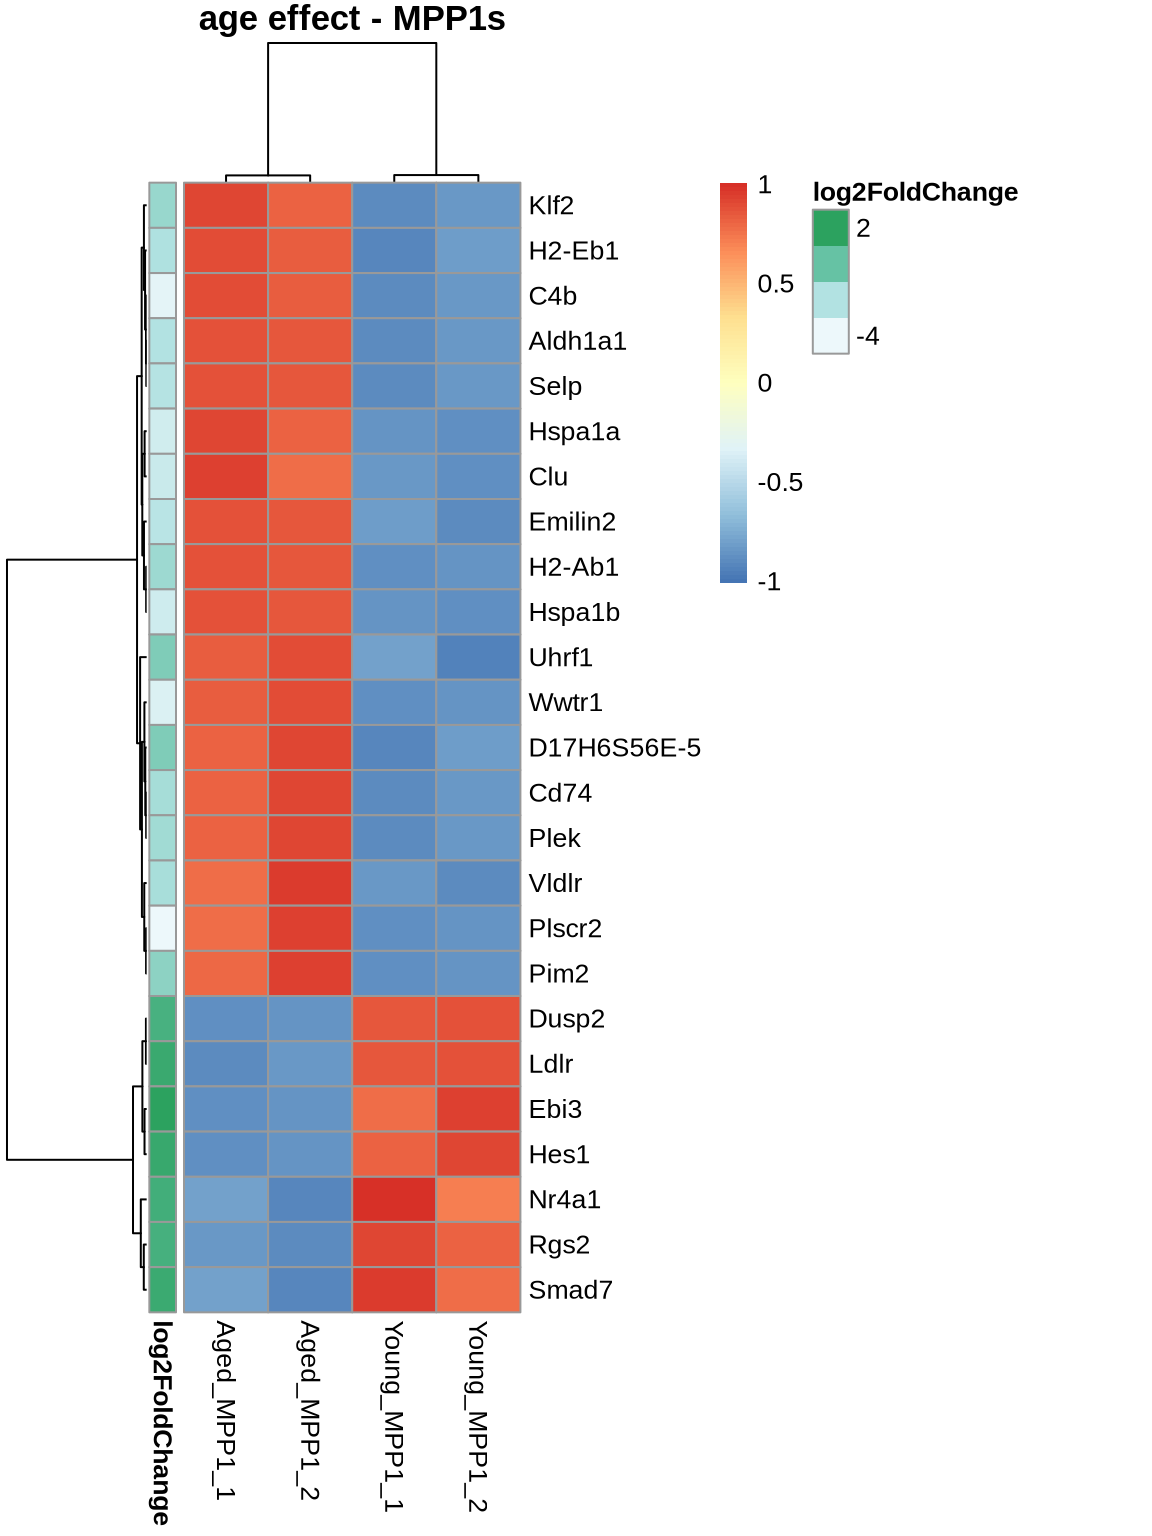
pheatmap(
  normcounts %>% subset(rownames(normcounts) %in% rownames(head(ageEffect_MPP1, 25))) %>% dplyr::select(3,4,9,10),
  scale = 'row',
  main='age effect - MPP1s',
  show_rownames = TRUE,
  annotation_row = ageEffect_MPP1[c(1:25), 'log2FoldChange', drop=FALSE]
  )
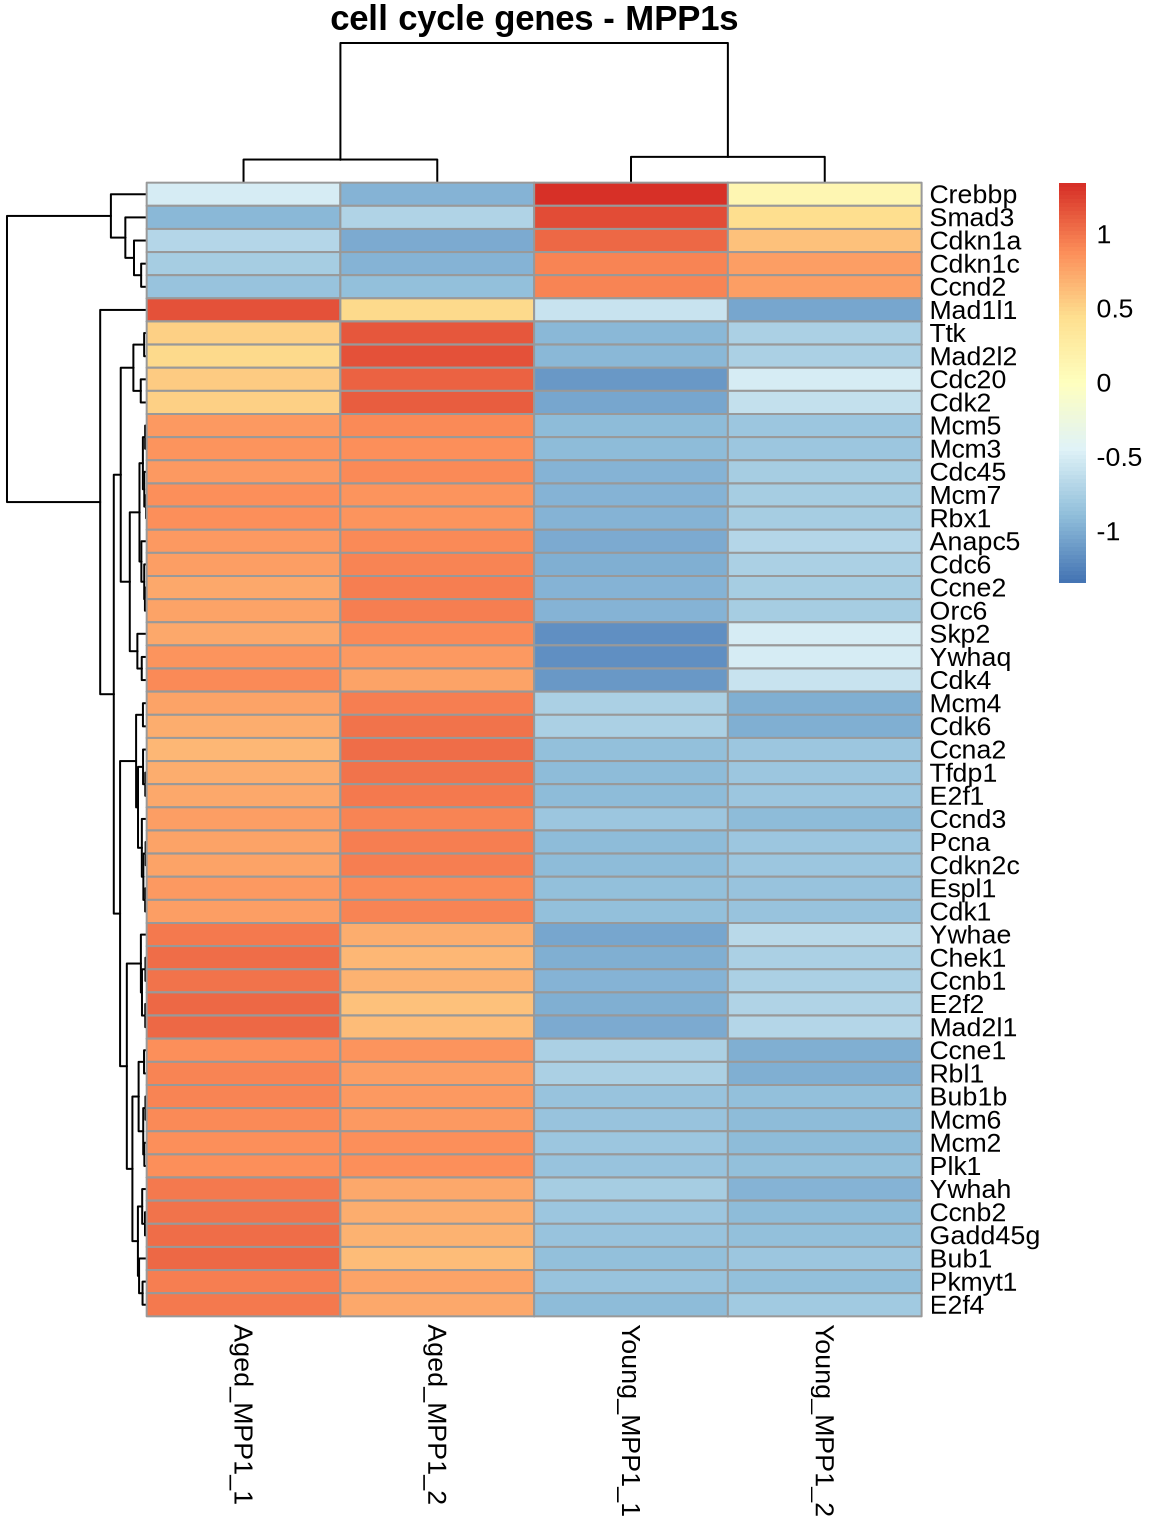
# cell cycle
ageEffect_HSC_cycle <- ageEffect_HSC %>%
  subset(rownames(.) %in% cellcycle) %>%
  subset(padj < 0.05)


ageEffect_MPP1_cycle <- ageEffect_MPP1 %>%
  subset(rownames(.) %in% cellcycle) %>%
  subset(padj < 0.05)

pheatmap(
  normcounts %>% subset(rownames(normcounts) %in% rownames(ageEffect_MPP1_cycle)) %>% dplyr::select(3,4,9,10),
  scale = 'row',
  main='cell cycle genes - MPP1s',
  show_rownames = TRUE
)
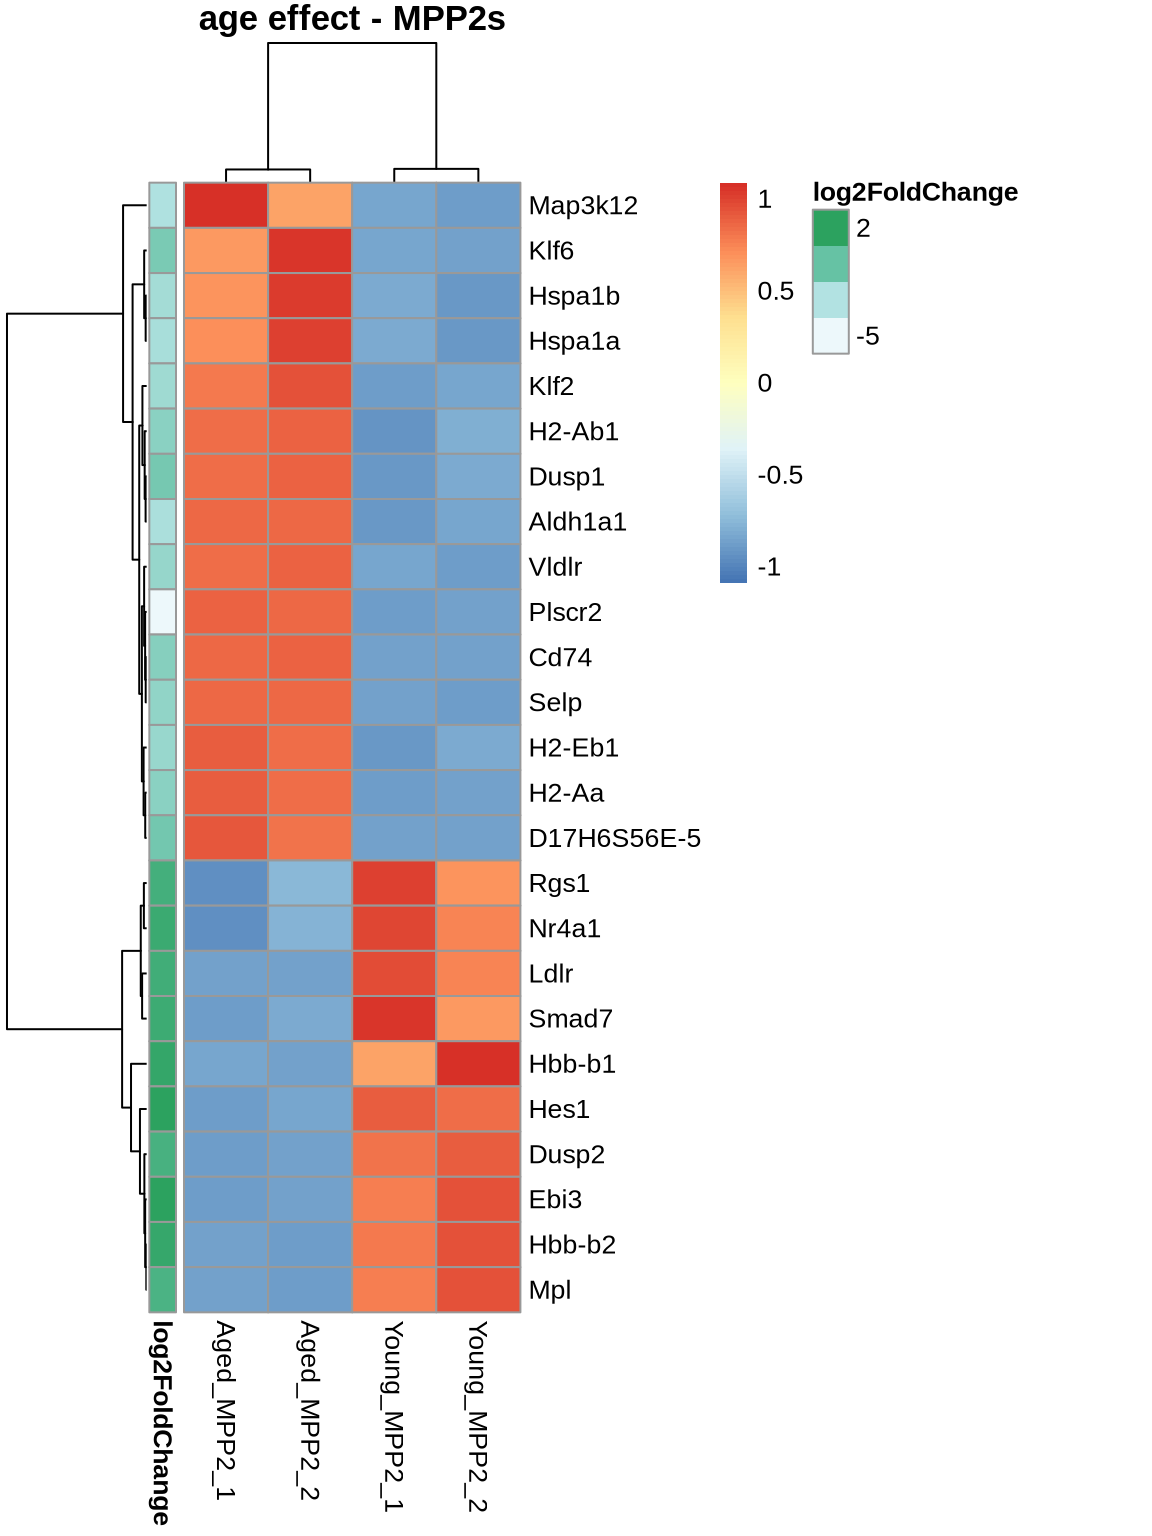
pheatmap(
  normcounts %>% subset(rownames(normcounts) %in% rownames(head(ageEffect_MPP2, 25))) %>% dplyr::select(5,6,11,12),
  scale = 'row',
  main='age effect - MPP2s',
  show_rownames = TRUE,
  annotation_row = ageEffect_MPP2[c(1:25), c('log2FoldChange'), drop=FALSE]
  )
# cell cycle
ageEffect_MPP2_cycle <- ageEffect_MPP2 %>%
subset(rownames(.) %in% cellcycle) %>%
subset(padj < 0.05)
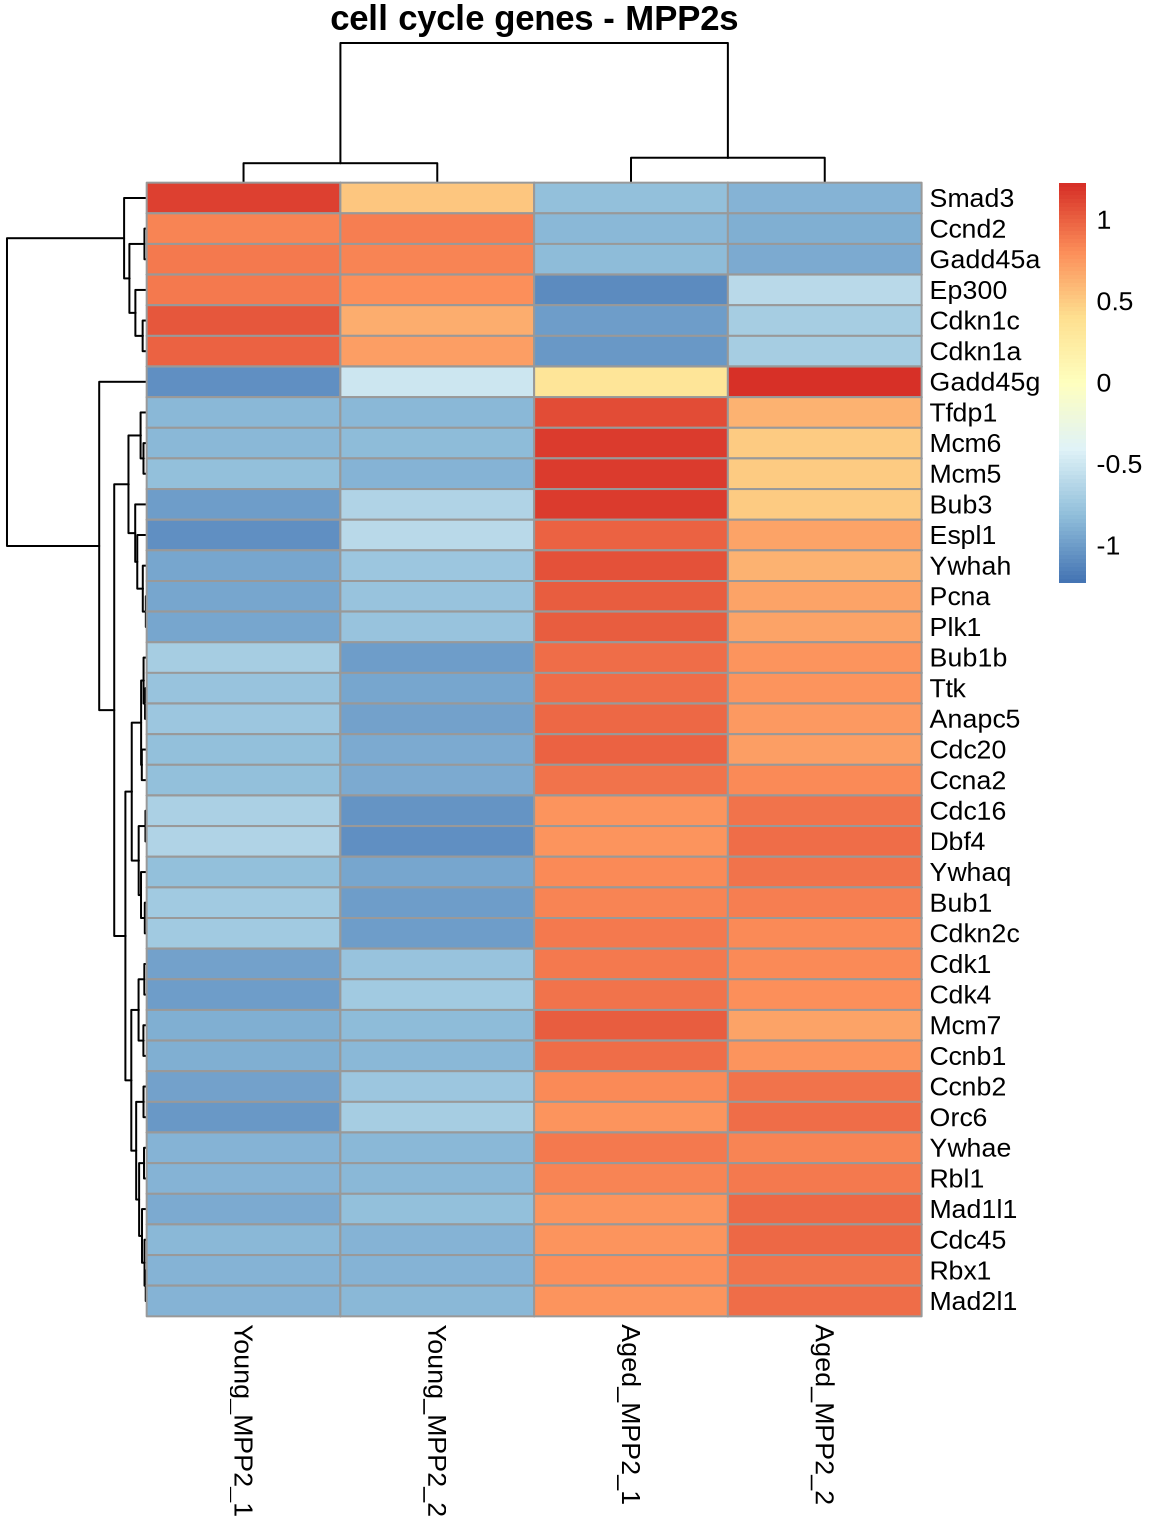
pheatmap(
normcounts %>% subset(rownames(normcounts) %in% rownames(ageEffect_MPP2_cycle)) %>% dplyr::select(5,6,11,12),
scale = 'row',
main='cell cycle genes - MPP2s',
show_rownames = TRUE
)
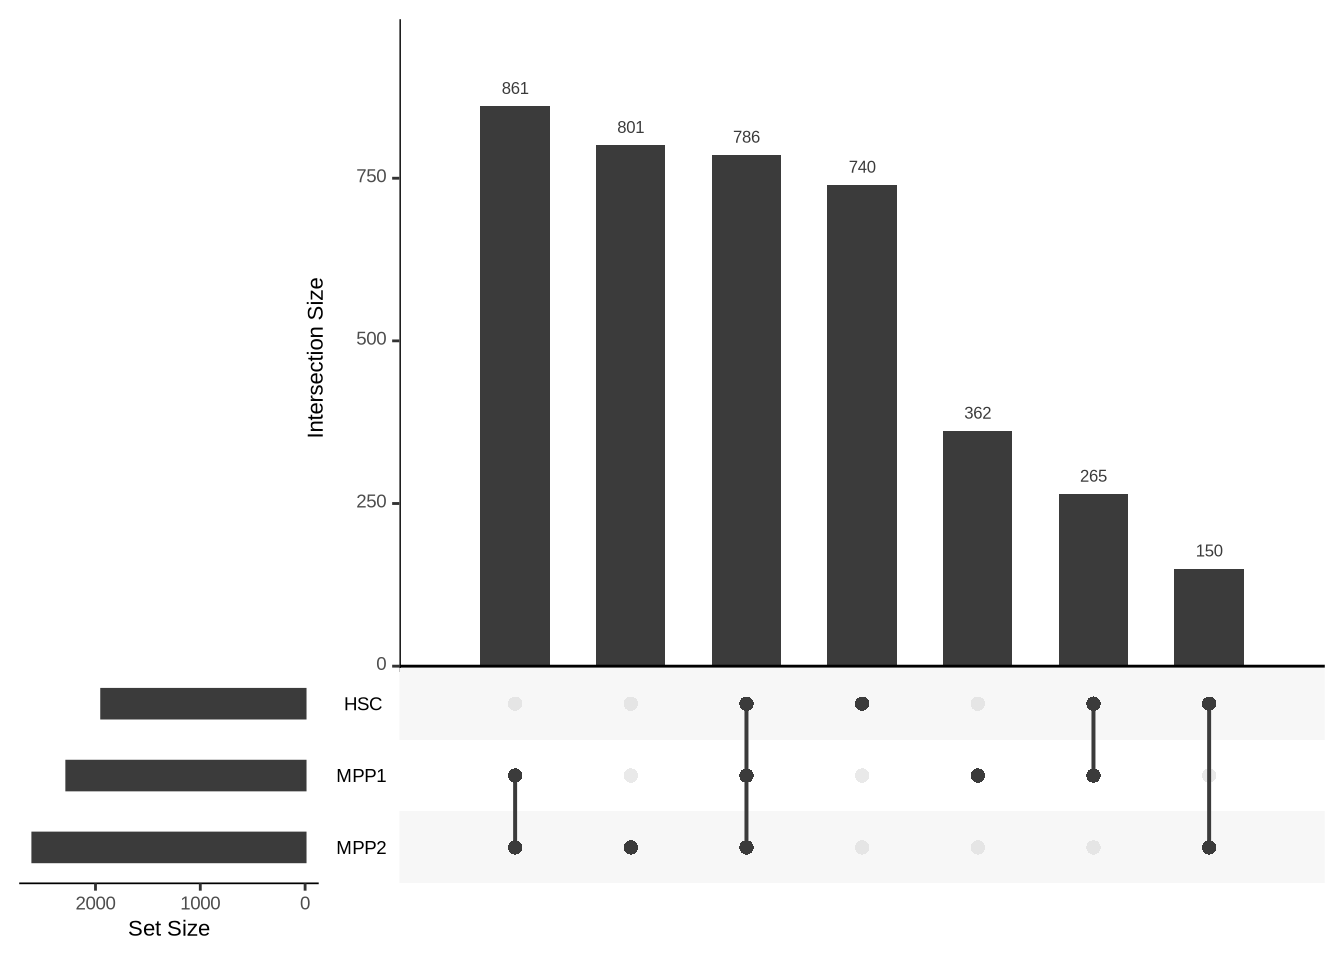
Common differential genes
upsetList <- list(
  "HSC" = ageEffect_HSC %>% dplyr::filter(padj < 0.05) %>% drop_na %>% rownames,
  "MPP1" = ageEffect_MPP1 %>% dplyr::filter(padj < 0.05) %>% drop_na %>% rownames,
  "MPP2" = ageEffect_MPP2 %>% dplyr::filter(padj < 0.05) %>% drop_na %>% rownames
  )

upset(fromList(upsetList), order.by = "freq")