DESeq2 Analysis with R: outline
Bioinfo-Core @ MPI-IE
Wed Jun 25 06:56:35 2025
This outline contains a template of a typical DESeq2 workflow - as
discussed during the course.
For specific projects, the parts on data exploration, quality controls
and filtering are frequently more iterative and could require
tweaking.
Load Libraries
library(DESeq2)
library(pheatmap)
library(tidyverse)
library(ashr)
Data, Metadata and Design
dfile <- "data/mpp/mpp_counts.tsv"
data <- read_tsv(dfile)
## Rows: 24417 Columns: 13
## ── Column specification ────────────────────────────────────────────────────────
## Delimiter: "\t"
## chr (1): gene_id
## dbl (12): Young_HSC_1, Young_HSC_2, Young_MPP1_1, Young_MPP1_2, Young_MPP2_1...
##
## ℹ Use `spec()` to retrieve the full column specification for this data.
## ℹ Specify the column types or set `show_col_types = FALSE` to quiet this message.data <- data %>% column_to_rownames("gene_id")
mfile <- "data/mpp/mpp_meta.tsv"
metadata <- read_tsv(mfile)## Rows: 12 Columns: 3
## ── Column specification ────────────────────────────────────────────────────────
## Delimiter: "\t"
## chr (3): sample, celltype, condition
##
## ℹ Use `spec()` to retrieve the full column specification for this data.
## ℹ Specify the column types or set `show_col_types = FALSE` to quiet this message.metadata <- metadata %>% column_to_rownames("sample")
metadata$condition <- as.factor(metadata$condition)
metadata$celltype <- as.factor(metadata$celltype)
my_design <- ~ celltype + condition + celltype:condition
all(rownames(metadata) == colnames(data)) # sanity check## [1] TRUEdds <- DESeqDataSetFromMatrix(countData=data, colData=metadata, design= my_design)## converting counts to integer modeData Exploration and Filters
# data exploration and QC: not shown
# ...

# remove genes
keep_genes <- rowSums(counts(dds)) > 1
dds <- dds[keep_genes,]

# process/filter samples as required
# ...

# rerun Data Exploration and QC
rld <- rlog(dds)
plotPCA(rld, intgroup=c("condition", "celltype"))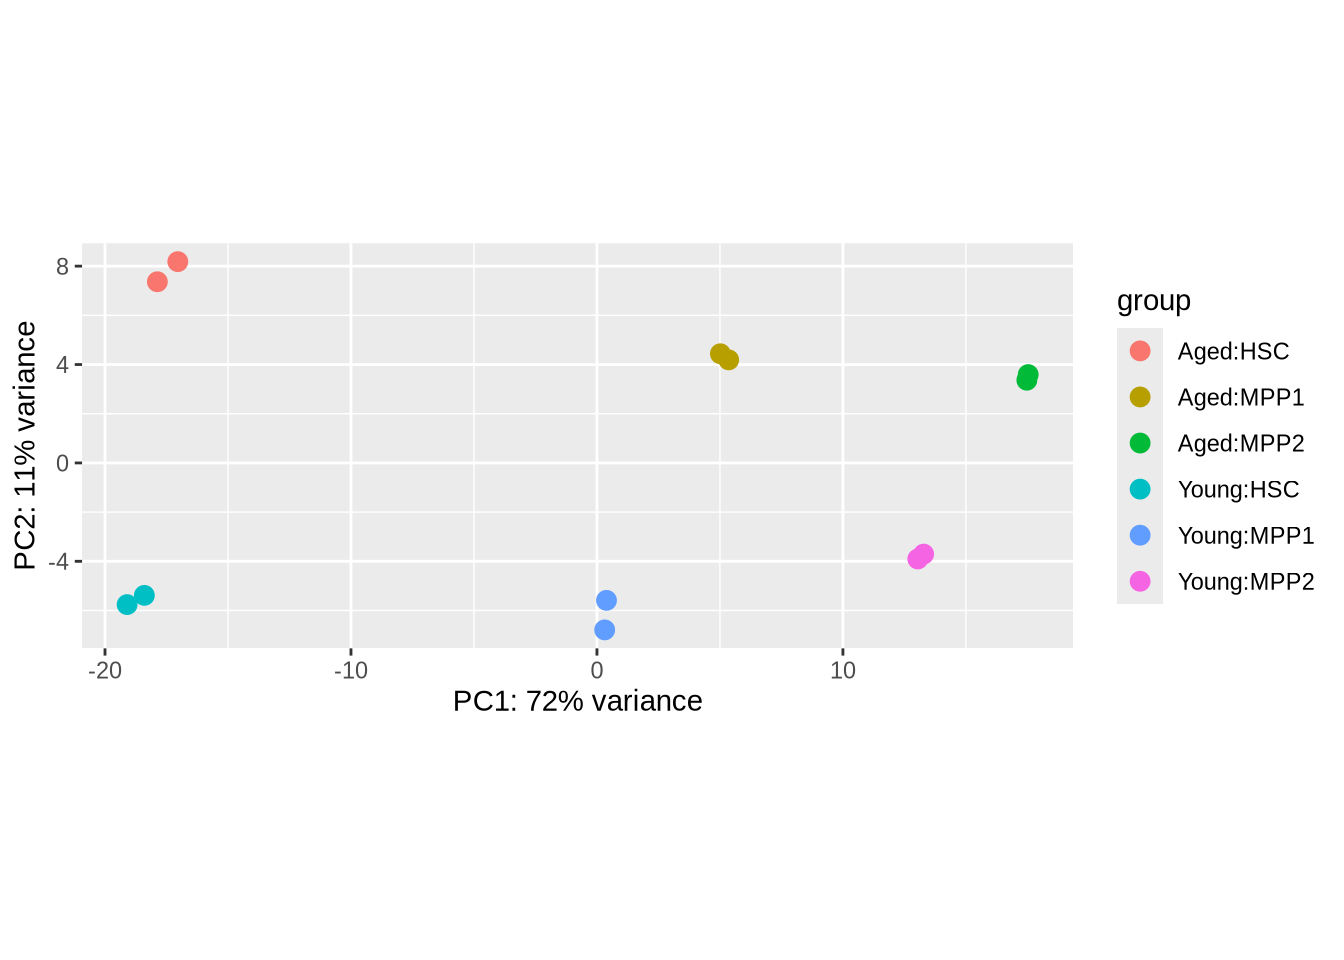
# keep transformed matrix A for later visualization
# scale rows (genes) for heatmap = transpose; (column) scale; transpose
A = assay(rld, normalized=TRUE) %>% t %>% scale %>% t
Run DESeq
dds <- DESeq(dds) ## estimating size factors## estimating dispersions## gene-wise dispersion estimates## mean-dispersion relationship## final dispersion estimates## fitting model and testing#Inspection
colData(dds) # sizefactors were added to metadata## DataFrame with 12 rows and 3 columns
## celltype condition sizeFactor
## <factor> <factor> <numeric>
## Young_HSC_1 HSC Young 0.874166
## Young_HSC_2 HSC Young 1.090789
## Young_MPP1_1 MPP1 Young 1.050110
## Young_MPP1_2 MPP1 Young 1.059677
## Young_MPP2_1 MPP2 Young 0.930771
## ... ... ... ...
## Aged_HSC_2 HSC Aged 1.07411
## Aged_MPP1_1 MPP1 Aged 0.98275
## Aged_MPP1_2 MPP1 Aged 1.10200
## Aged_MPP2_1 MPP2 Aged 1.00093
## Aged_MPP2_2 MPP2 Aged 1.04783plotDispEsts(dds, main="Dispersion plot") # dispersion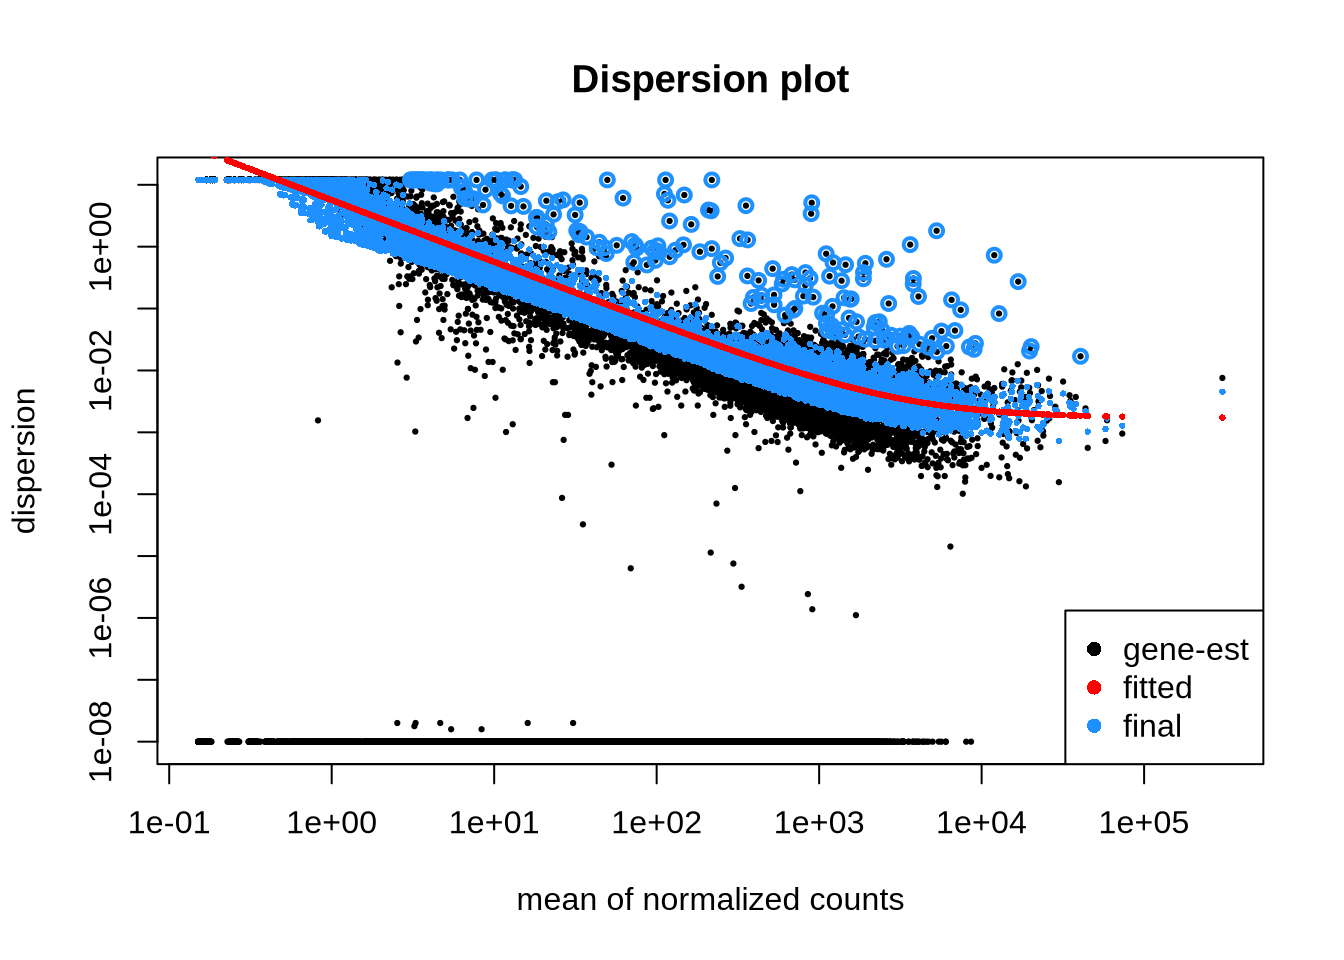
# mcols(dds) # for the really curious: results of modelingContrasts
Verify (base) levels and available coefficient (resultsNames).
Define model matrix and contrasts systematically
colData(dds)$condition## [1] Young Young Young Young Young Young Aged Aged Aged Aged Aged Aged
## Levels: Aged YoungcolData(dds)$celltype## [1] HSC HSC MPP1 MPP1 MPP2 MPP2 HSC HSC MPP1 MPP1 MPP2 MPP2
## Levels: HSC MPP1 MPP2resultsNames(dds)## [1] "Intercept" "celltype_MPP1_vs_HSC"
## [3] "celltype_MPP2_vs_HSC" "condition_Young_vs_Aged"
## [5] "celltypeMPP1.conditionYoung" "celltypeMPP2.conditionYoung"mod_mat <- model.matrix(my_design, metadata)
# define contrast systematically
Aged_MPP2 <- which(dds$condition=="Aged" & dds$celltype=="MPP2")
Young_MPP2 <- which(dds$condition=="Young" & dds$celltype=="MPP2")
YvA_MPP2=colMeans(mod_mat[Young_MPP2,]) - colMeans(mod_mat[Aged_MPP2,])
YvA_MPP2## (Intercept) celltypeMPP1
## 0 0
## celltypeMPP2 conditionYoung
## 0 1
## celltypeMPP1:conditionYoung celltypeMPP2:conditionYoung
## 0 1Results
res <- lfcShrink(dds, contrast=YvA_MPP2, type = "ashr") ## using 'ashr' for LFC shrinkage. If used in published research, please cite:
## Stephens, M. (2016) False discovery rates: a new deal. Biostatistics, 18:2.
## https://doi.org/10.1093/biostatistics/kxw041# inspect results
res %>% head(5) # first few results## log2 fold change (MMSE): 0,0,0,+1,0,+1
## Wald test p-value: 0,0,0,+1,0,+1
## DataFrame with 5 rows and 5 columns
## baseMean log2FoldChange lfcSE pvalue padj
## <numeric> <numeric> <numeric> <numeric> <numeric>
## Plekhg2 133.8963 0.116174 0.185884 3.10302e-01 5.60298e-01
## Plekhg3 195.2731 0.134482 0.171969 2.46270e-01 4.89375e-01
## Plekhg1 120.6119 0.807279 0.548689 5.10819e-04 4.86566e-03
## Plekhg6 77.5309 0.335161 0.517385 1.56011e-02 7.23021e-02
## Plekhg5 168.7902 0.872573 0.276774 1.28764e-06 2.82492e-05summary(res) # summary for all genes##
## out of 16478 with nonzero total read count
## adjusted p-value < 0.1
## LFC > 0 (up) : 1482, 9%
## LFC < 0 (down) : 1818, 11%
## outliers [1] : 0, 0%
## low counts [2] : 2876, 17%
## (mean count < 4)
## [1] see 'cooksCutoff' argument of ?results
## [2] see 'independentFiltering' argument of ?resultsplotMA(res, ylim=c(-3,3)) # MA-plot from DESeq2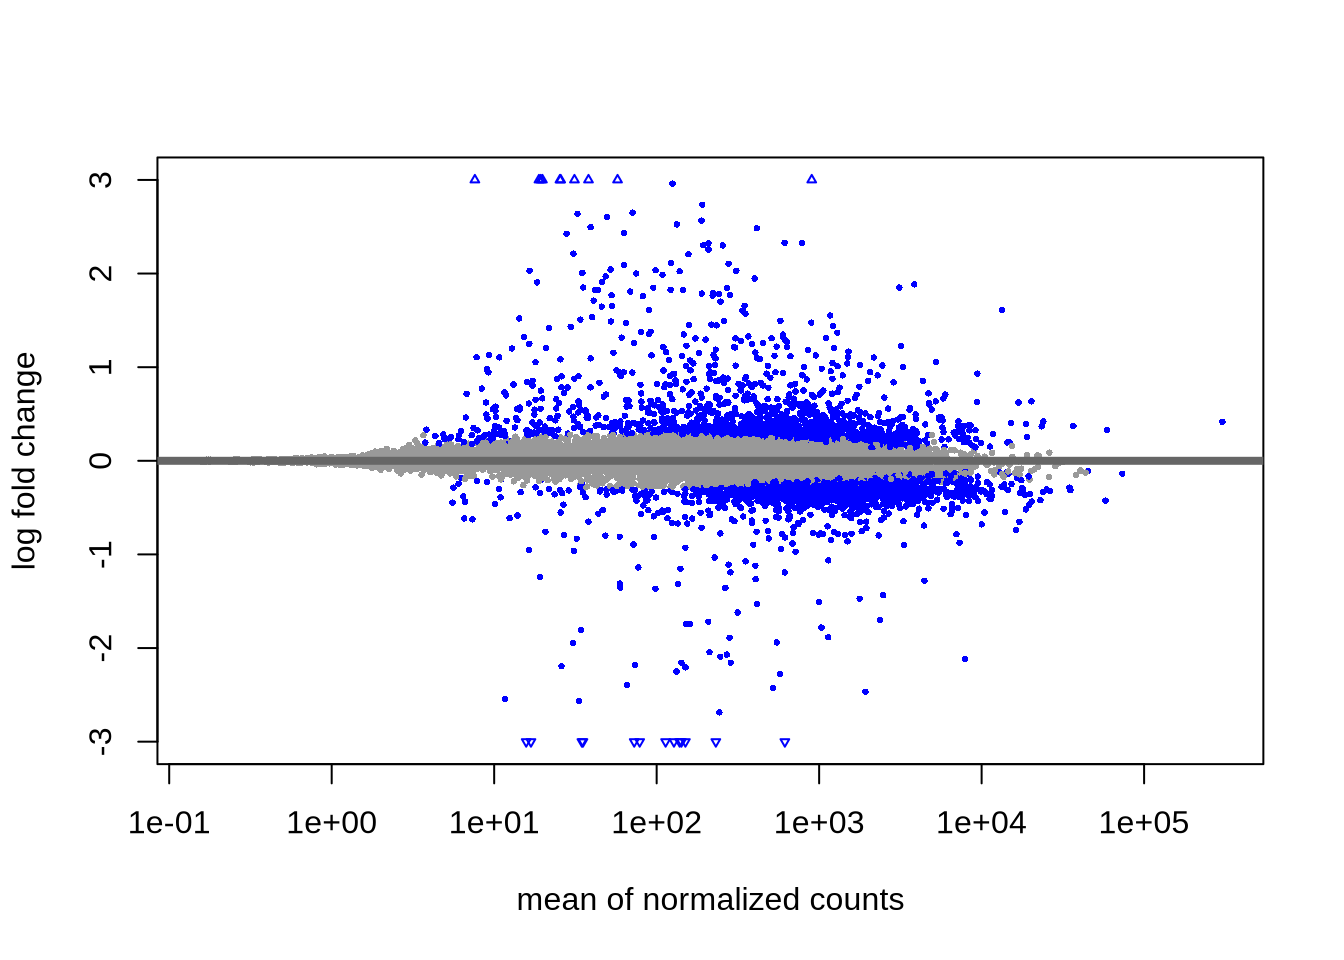
plot(res$log2FoldChange, -log10(res$padj), cex=0.3) # very simple volcano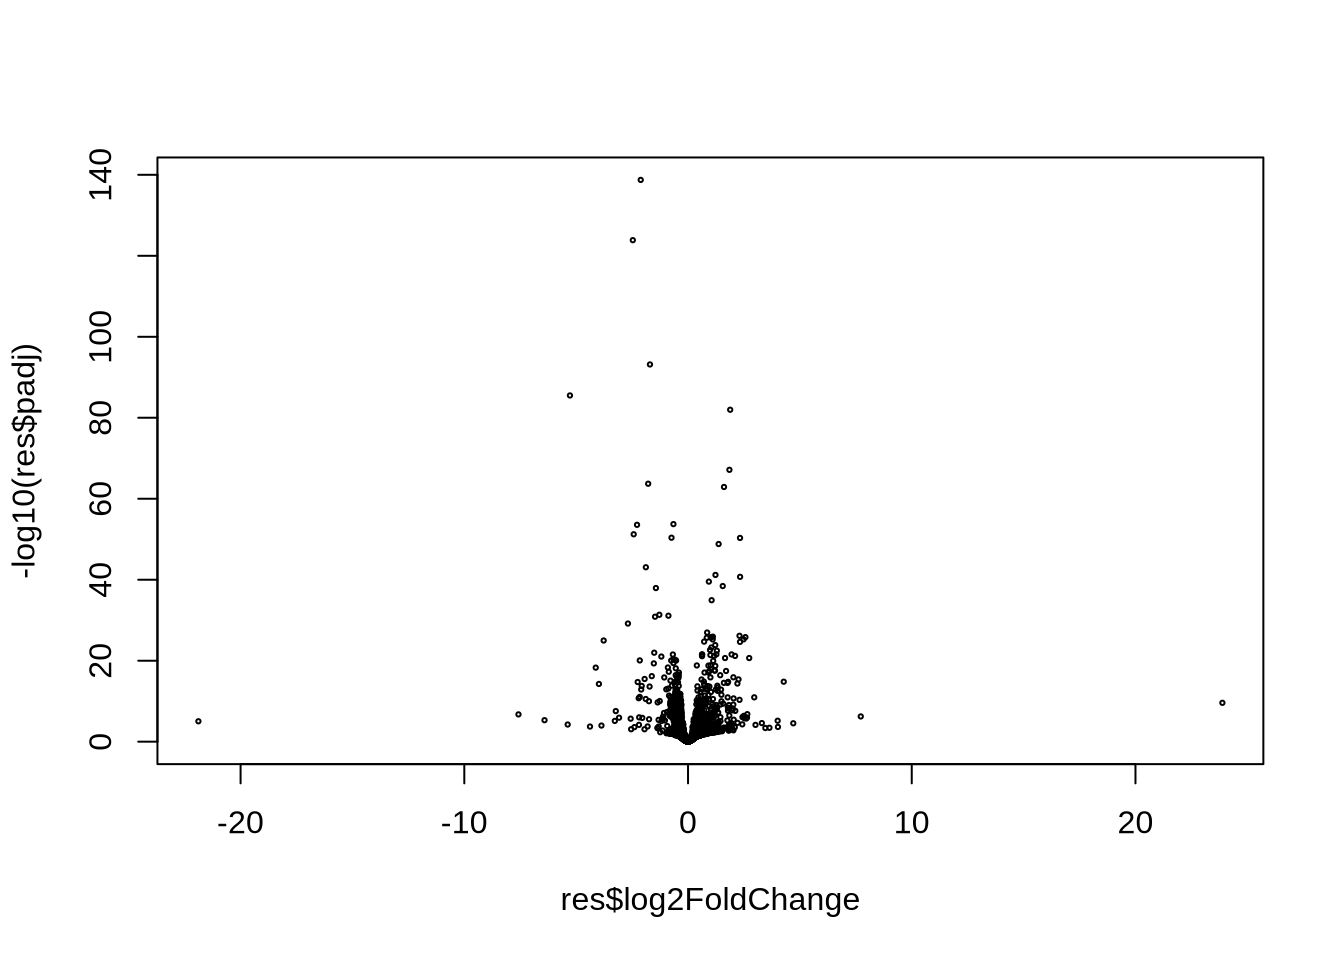
#my_volcano(res)                                        # better?

# plot top-gene
plotCounts(dds, gene=which.min(res$padj), intgroup=c("condition","celltype")) 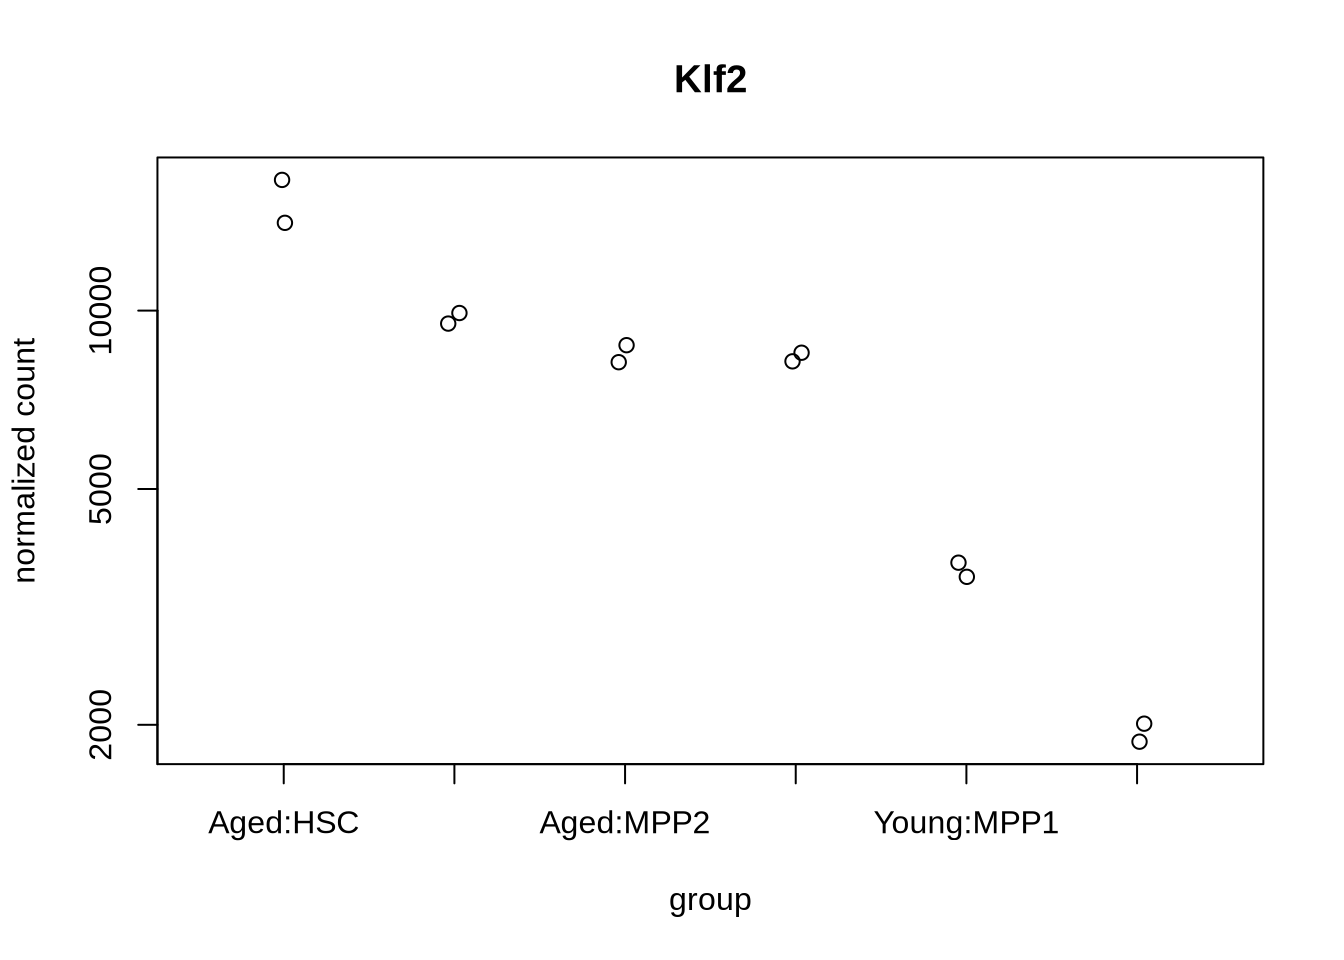
# plot heatmap for top 15 genes
ntop <- 15
sorted_res <- res %>% data.frame() %>% arrange(padj)   # sort results by padj
top_genes <- sorted_res %>% head(ntop) %>% row.names() # top gene names
col_sel=c(Young_MPP2, Aged_MPP2)                       # select only samples in contrast
pheatmap(A[top_genes,col_sel], main="Top DE Genes (rlog)", annotation=metadata)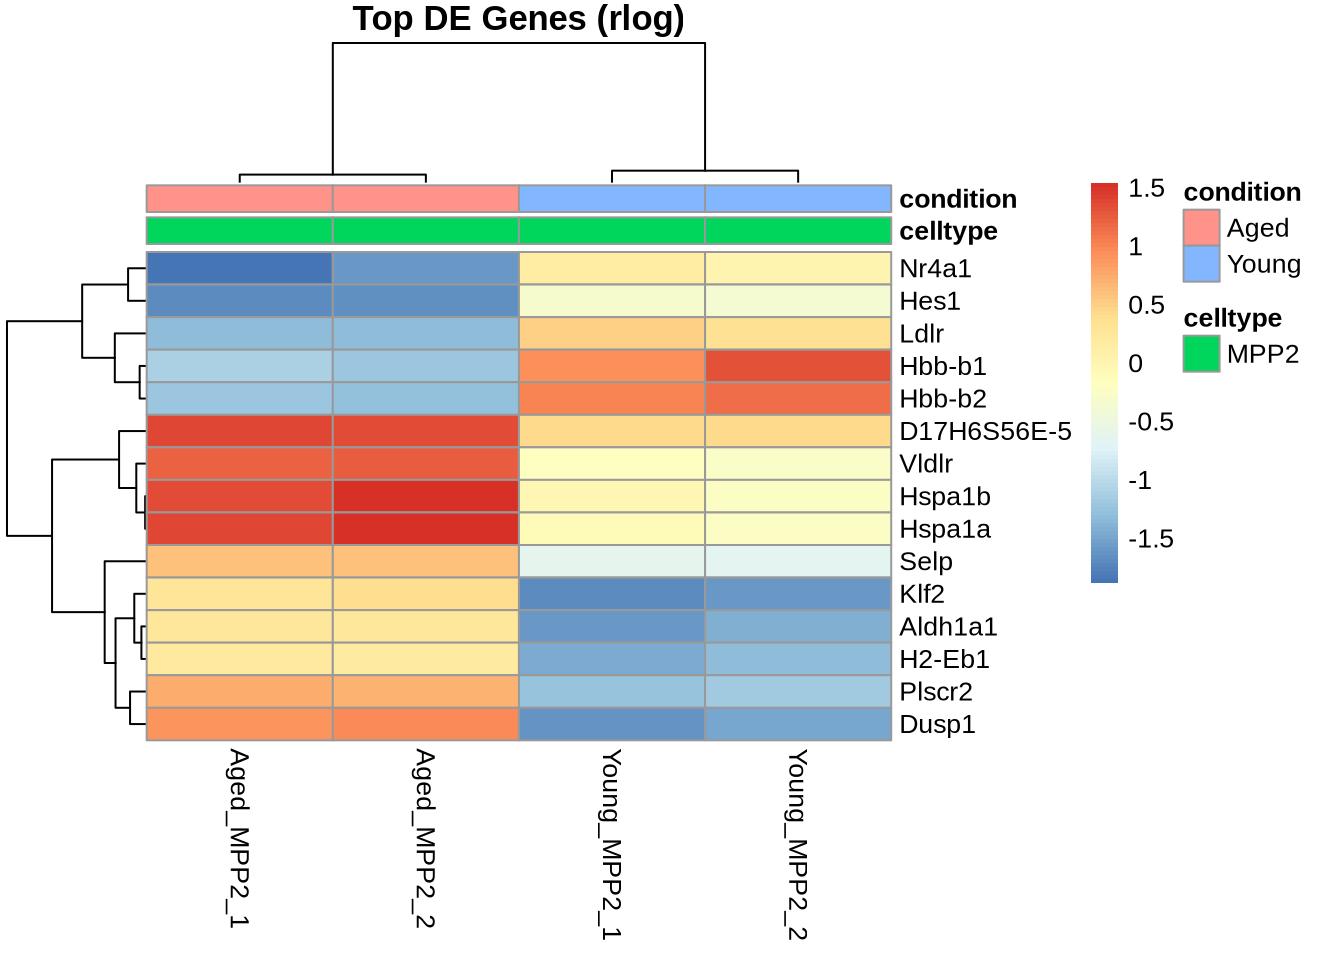
# write sorted results to file (add rowname as column)
fn="results.tsv"                        # might need a more informative filename
write_tsv(sorted_res %>% rownames_to_column("Gene"), file=fn)
SessionInfo
sessionInfo()## R version 4.2.3 (2023-03-15)
## Platform: x86_64-conda-linux-gnu (64-bit)
## Running under: Ubuntu 24.04.2 LTS
##
## Matrix products: default
## BLAS/LAPACK: /home/runner/micromamba/envs/Rdeseq2/lib/libopenblasp-r0.3.30.so
##
## locale:
## [1] LC_CTYPE=C.UTF-8 LC_NUMERIC=C LC_TIME=C.UTF-8
## [4] LC_COLLATE=C.UTF-8 LC_MONETARY=C.UTF-8 LC_MESSAGES=C.UTF-8
## [7] LC_PAPER=C.UTF-8 LC_NAME=C LC_ADDRESS=C
## [10] LC_TELEPHONE=C LC_MEASUREMENT=C.UTF-8 LC_IDENTIFICATION=C
##
## attached base packages:
## [1] stats4 stats graphics grDevices utils datasets methods
## [8] base
##
## other attached packages:
## [1] BiocManager_1.30.23 gridExtra_2.3
## [3] ashr_2.2-63 UpSetR_1.4.0
## [5] EnsDb.Hsapiens.v75_2.99.0 ensembldb_2.22.0
## [7] AnnotationFilter_1.22.0 GenomicFeatures_1.50.2
## [9] AnnotationDbi_1.60.0 ggrepel_0.9.5
## [11] patchwork_1.2.0 pheatmap_1.0.12
## [13] lubridate_1.9.3 forcats_1.0.0
## [15] stringr_1.5.1 dplyr_1.1.4
## [17] purrr_1.0.2 readr_2.1.5
## [19] tidyr_1.3.1 tibble_3.2.1
## [21] ggplot2_3.5.1 tidyverse_2.0.0
## [23] DESeq2_1.38.0 SummarizedExperiment_1.28.0
## [25] Biobase_2.58.0 MatrixGenerics_1.10.0
## [27] matrixStats_1.3.0 GenomicRanges_1.50.0
## [29] GenomeInfoDb_1.34.9 IRanges_2.32.0
## [31] S4Vectors_0.36.0 BiocGenerics_0.44.0
##
## loaded via a namespace (and not attached):
## [1] colorspace_2.1-0 rjson_0.2.21 XVector_0.38.0
## [4] farver_2.1.2 bit64_4.0.5 fansi_1.0.6
## [7] xml2_1.3.6 codetools_0.2-20 splines_4.2.3
## [10] cachem_1.1.0 geneplotter_1.76.0 knitr_1.47
## [13] jsonlite_1.8.8 Rsamtools_2.14.0 annotate_1.76.0
## [16] dbplyr_2.5.0 png_0.1-8 compiler_4.2.3
## [19] httr_1.4.7 Matrix_1.6-5 fastmap_1.2.0
## [22] lazyeval_0.2.2 cli_3.6.3 htmltools_0.5.8.1
## [25] prettyunits_1.2.0 tools_4.2.3 gtable_0.3.5
## [28] glue_1.7.0 GenomeInfoDbData_1.2.9 rappdirs_0.3.3
## [31] Rcpp_1.0.12 jquerylib_0.1.4 vctrs_0.6.5
## [34] Biostrings_2.66.0 rtracklayer_1.58.0 xfun_0.45
## [37] irlba_2.3.5.1 timechange_0.3.0 lifecycle_1.0.4
## [40] restfulr_0.0.15 XML_3.99-0.17 zlibbioc_1.44.0
## [43] MASS_7.3-60.0.1 scales_1.3.0 vroom_1.6.5
## [46] ProtGenerics_1.30.0 hms_1.1.3 parallel_4.2.3
## [49] RColorBrewer_1.1-3 yaml_2.3.8 curl_5.1.0
## [52] memoise_2.0.1 sass_0.4.9 biomaRt_2.54.0
## [55] SQUAREM_2021.1 stringi_1.8.4 RSQLite_2.3.4
## [58] highr_0.11 genefilter_1.80.0 BiocIO_1.8.0
## [61] filelock_1.0.3 BiocParallel_1.32.5 truncnorm_1.0-9
## [64] rlang_1.1.4 pkgconfig_2.0.3 bitops_1.0-7
## [67] invgamma_1.1 evaluate_0.24.0 lattice_0.22-6
## [70] fontawesome_0.5.2 GenomicAlignments_1.34.0 labeling_0.4.3
## [73] bit_4.0.5 tidyselect_1.2.1 plyr_1.8.9
## [76] magrittr_2.0.3 R6_2.5.1 generics_0.1.3
## [79] DelayedArray_0.24.0 DBI_1.2.3 pillar_1.9.0
## [82] withr_3.0.0 mixsqp_0.3-54 survival_3.7-0
## [85] KEGGREST_1.38.0 RCurl_1.98-1.14 crayon_1.5.3
## [88] KernSmooth_2.23-24 utf8_1.2.4 BiocFileCache_2.6.0
## [91] tzdb_0.4.0 rmarkdown_2.27 progress_1.2.3
## [94] locfit_1.5-9.9 grid_4.2.3 blob_1.2.4
## [97] digest_0.6.36 xtable_1.8-4 munsell_0.5.1
## [100] bslib_0.7.0